\n
## Bar Chart: Accuracy Comparison of Decomposition Methods
### Overview
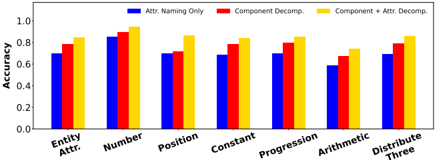
This image presents a bar chart comparing the accuracy of three different decomposition methods ("Attr. Naming Only", "Component Decomp.", and "Component + Attr. Decomp.") across seven different categories: "Entity Attr.", "Number", "Position", "Constant", "Progression", "Arithmetic", and "Distribute Three". The y-axis represents accuracy, ranging from 0.0 to 1.0.
### Components/Axes
* **X-axis:** Categories - "Entity Attr.", "Number", "Position", "Constant", "Progression", "Arithmetic", "Distribute Three".
* **Y-axis:** Accuracy, labeled from 0.0 to 1.0 with increments of 0.2.
* **Legend:** Located at the top-center of the chart.
* Blue: "Attr. Naming Only"
* Red: "Component Decomp."
* Yellow: "Component + Attr. Decomp."
### Detailed Analysis
The chart consists of seven groups of three bars, one for each decomposition method within each category.
* **Entity Attr.:**
* Attr. Naming Only (Blue): Approximately 0.74
* Component Decomp. (Red): Approximately 0.82
* Component + Attr. Decomp. (Yellow): Approximately 0.88
* **Number:**
* Attr. Naming Only (Blue): Approximately 0.86
* Component Decomp. (Red): Approximately 0.91
* Component + Attr. Decomp. (Yellow): Approximately 0.95
* **Position:**
* Attr. Naming Only (Blue): Approximately 0.68
* Component Decomp. (Red): Approximately 0.72
* Component + Attr. Decomp. (Yellow): Approximately 0.92
* **Constant:**
* Attr. Naming Only (Blue): Approximately 0.72
* Component Decomp. (Red): Approximately 0.78
* Component + Attr. Decomp. (Yellow): Approximately 0.84
* **Progression:**
* Attr. Naming Only (Blue): Approximately 0.69
* Component Decomp. (Red): Approximately 0.79
* Component + Attr. Decomp. (Yellow): Approximately 0.86
* **Arithmetic:**
* Attr. Naming Only (Blue): Approximately 0.62
* Component Decomp. (Red): Approximately 0.68
* Component + Attr. Decomp. (Yellow): Approximately 0.75
* **Distribute Three:**
* Attr. Naming Only (Blue): Approximately 0.72
* Component Decomp. (Red): Approximately 0.78
* Component + Attr. Decomp. (Yellow): Approximately 0.86
**Trends:**
* "Component + Attr. Decomp." (Yellow) consistently achieves the highest accuracy across all categories.
* "Component Decomp." (Red) generally outperforms "Attr. Naming Only" (Blue).
* The accuracy varies significantly across categories, with "Number" showing the highest overall accuracy and "Arithmetic" the lowest.
### Key Observations
* The "Component + Attr. Decomp." method demonstrates a clear advantage in accuracy compared to the other two methods.
* The "Arithmetic" category consistently yields the lowest accuracy scores for all methods.
* The "Position" category shows the largest improvement when using "Component + Attr. Decomp." compared to "Attr. Naming Only".
### Interpretation
The data suggests that combining component decomposition with attribute naming provides the most accurate results across a range of categories. This indicates that leveraging both the structural and semantic information of the data leads to improved performance. The consistently lower accuracy in the "Arithmetic" category might suggest that this type of data presents unique challenges for these decomposition methods, potentially requiring specialized techniques. The large gains observed in "Position" when using the combined method suggest that attribute naming is particularly helpful in disambiguating positional information. Overall, the chart highlights the benefits of a holistic approach to data decomposition, integrating both component-based and attribute-based analysis.