## Flowchart: Causal Relationship Diagram
### Overview
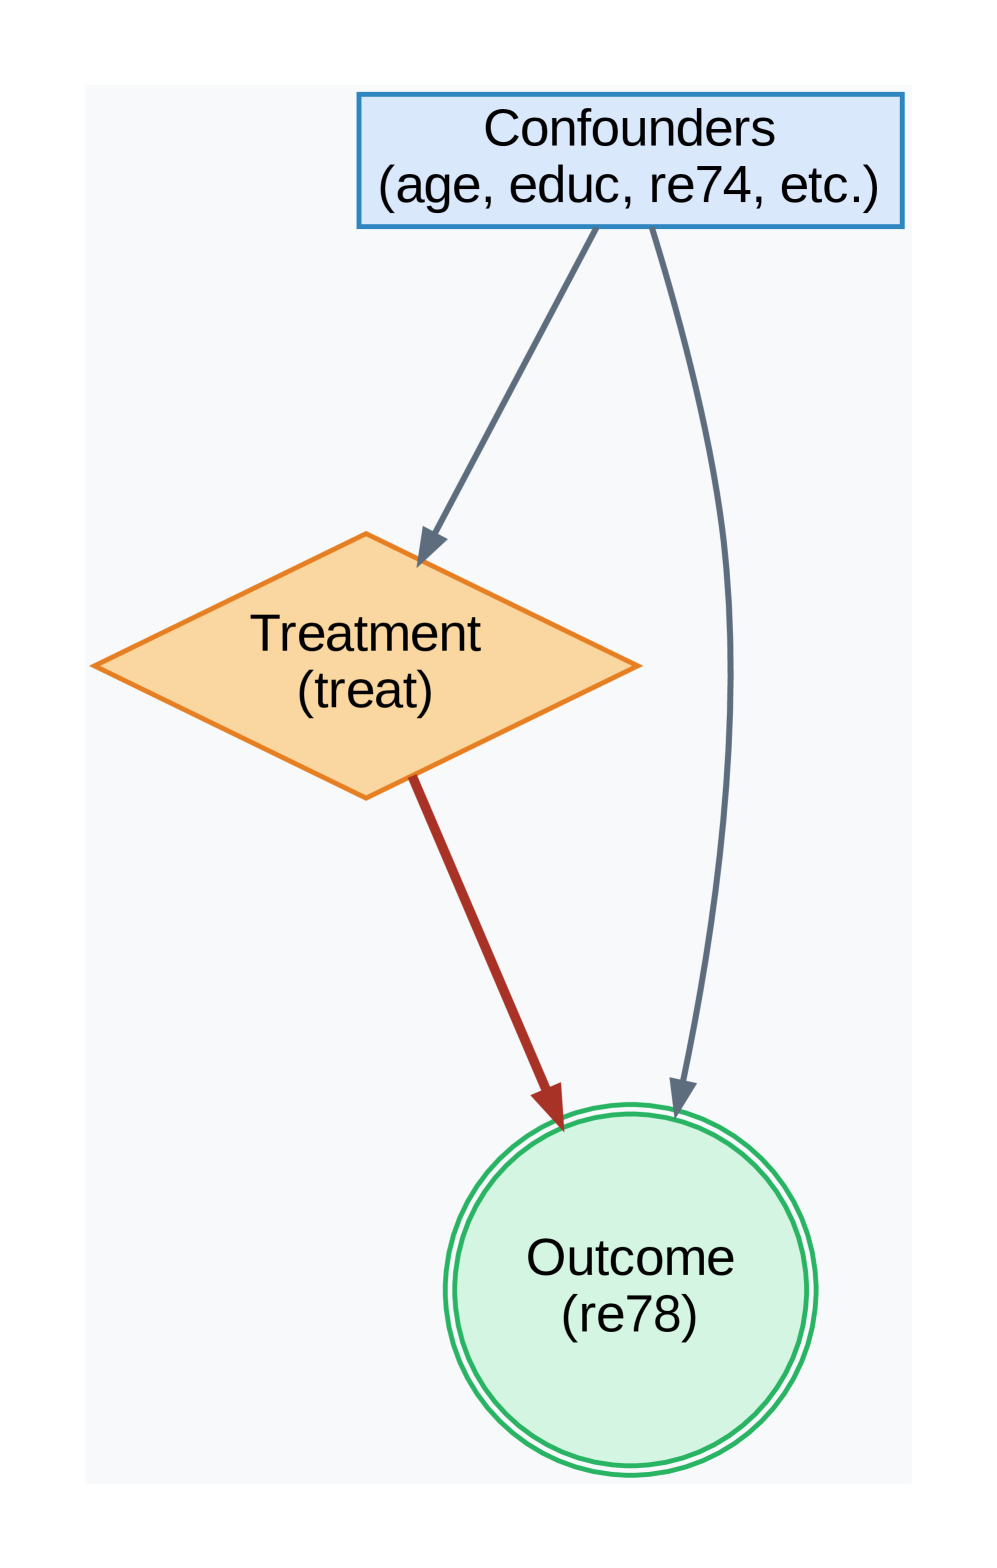
The image depicts a simplified causal flowchart illustrating relationships between confounders, treatment, and outcome variables. It uses standard flowchart notation with colored shapes and directional arrows to represent dependencies.
### Components/Axes
1. **Confounders** (Top):
- Rectangular blue box labeled "Confounders (age, educ, re74, etc.)"
- Contains variables: age, education (educ), re74 (likely a year or measurement), and unspecified additional factors
2. **Treatment** (Left):
- Orange diamond labeled "Treatment (treat)"
- Represents a decision node or intervention variable
3. **Outcome** (Bottom):
- Green circle labeled "Outcome (re78)"
- Contains the dependent variable "re78" (possibly a year or measurement)
4. **Arrows**:
- Gray arrows connect Confounders to both Treatment and Outcome
- Red arrow connects Treatment to Outcome
### Detailed Analysis
- **Confounders**: Explicitly lists age, education (abbreviated "educ"), and re74. The "etc." implies additional unlisted variables.
- **Treatment**: Positioned as a mediator between confounders and outcome.
- **Outcome**: Final node labeled "re78," suggesting a temporal or sequential relationship (e.g., re74 → re78).
- **Color Coding**:
- Blue (Confounders) → Gray arrows to Treatment/Outcome
- Orange (Treatment) → Red arrow to Outcome
- Green (Outcome)
### Key Observations
1. **Bidirectional Confounder Influence**: Confounders affect both Treatment and Outcome directly.
2. **Direct Treatment Effect**: The red arrow indicates a hypothesized causal pathway from Treatment to Outcome.
3. **Variable Naming**: Uses abbreviations (educ, re74, re78) suggesting domain-specific terminology (e.g., econometrics or social sciences).
### Interpretation
This diagram represents a **Directed Acyclic Graph (DAG)** used in causal inference analysis. It illustrates:
- **Confounder Control**: The need to account for variables like age and education that may influence both treatment assignment and outcomes.
- **Mediation Pathway**: Treatment (treat) is proposed as a direct cause of the outcome (re78), but its effect may be confounded by unmeasured variables.
- **Temporal Structure**: The use of "re74" and "re78" implies a 4-year gap, suggesting longitudinal analysis (e.g., treatment in 1974 affecting outcomes in 1978).
**Notable Design Choices**:
- Diamond shape for Treatment emphasizes its role as a decision point.
- Circular Outcome node highlights its status as the endpoint.
- Gray arrows for confounders visually subordinate them to the primary Treatment→Outcome relationship.
This structure is typical in observational studies to identify potential biases and justify adjustment methods (e.g., regression, propensity score matching).