## Line Chart: Competition Level Accuracy (%)
### Overview
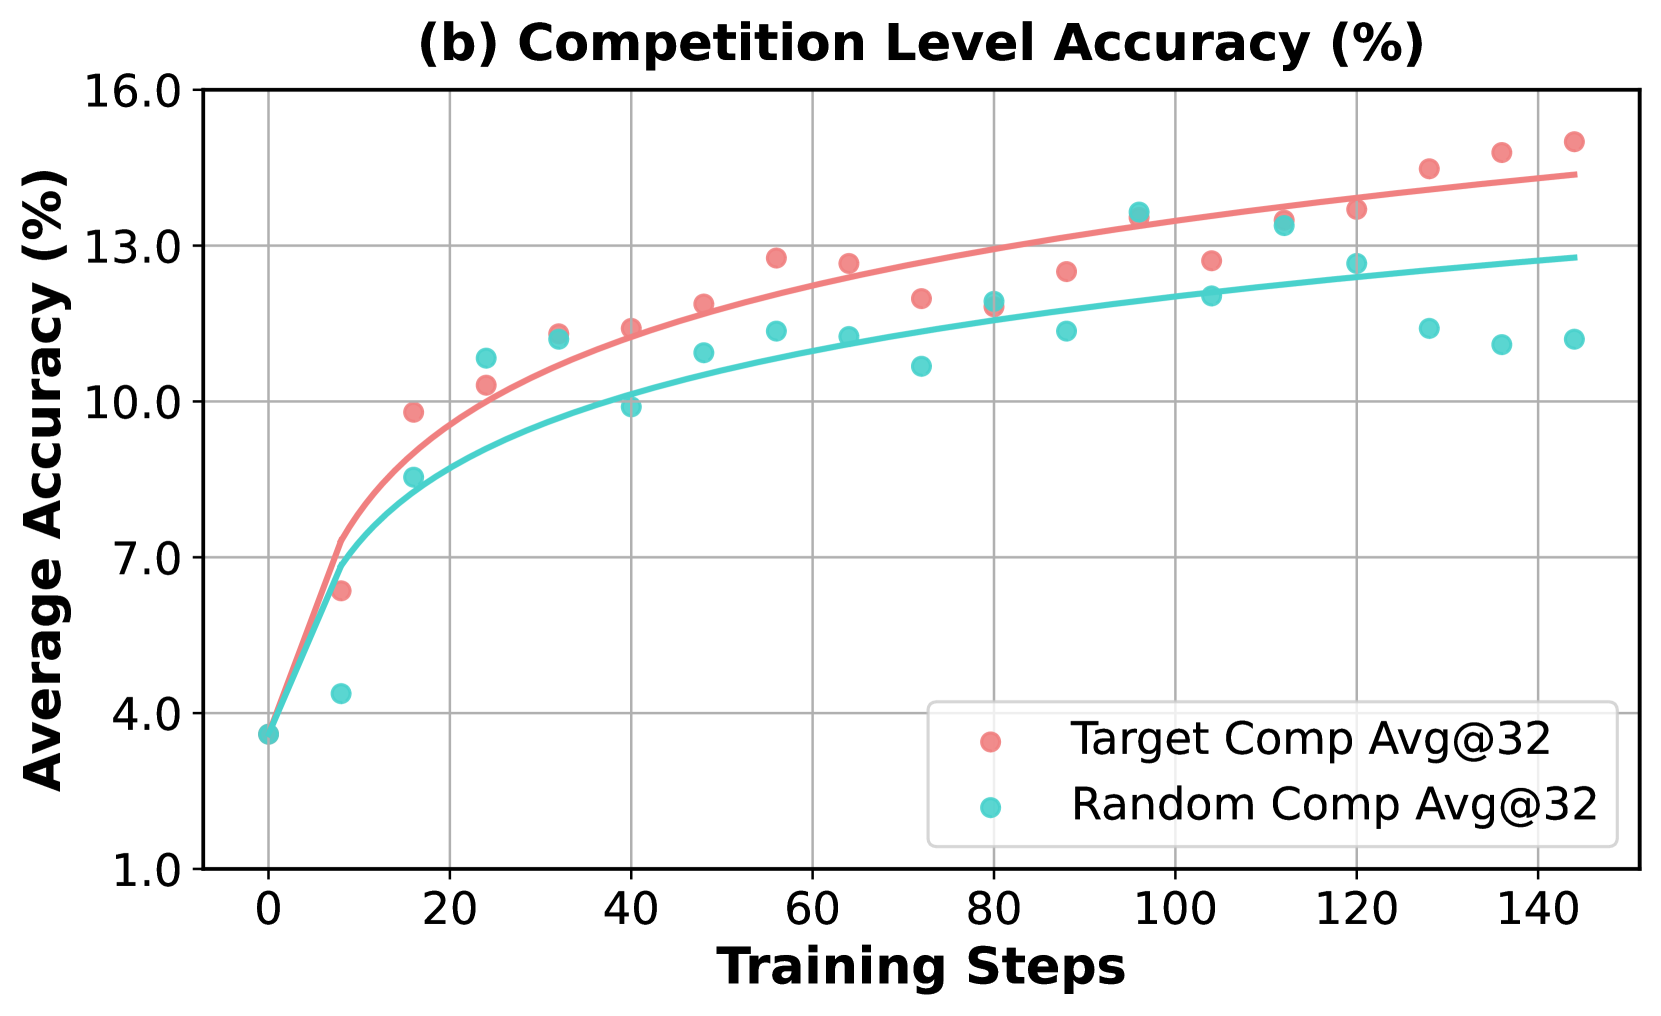
This chart displays the average accuracy (%) of two different competition setups ("Target Comp Avg@32" and "Random Comp Avg@32") as a function of training steps. The chart aims to compare the performance of a targeted competition approach versus a random competition approach during a training process.
### Components/Axes
* **Title:** (b) Competition Level Accuracy (%) - positioned at the top-center.
* **X-axis:** Training Steps - ranging from approximately 0 to 140.
* **Y-axis:** Average Accuracy (%) - ranging from approximately 1.0 to 16.0.
* **Legend:** Located in the bottom-right corner.
* Target Comp Avg@32 - represented by red circles.
* Random Comp Avg@32 - represented by teal circles.
* **Data Series:** Two lines representing the accuracy trends for each competition setup, with data points marked by circles.
* **Gridlines:** A light gray grid is present to aid in reading values.
### Detailed Analysis
**Target Comp Avg@32 (Red Line):**
The red line shows an upward trend, starting at approximately 3.8% accuracy at 0 training steps. The line initially increases rapidly, then the rate of increase slows down.
* (0, 3.8)
* (10, 8.8)
* (20, 9.6)
* (30, 11.2)
* (40, 12.2)
* (50, 12.8)
* (60, 13.2)
* (70, 13.6)
* (80, 14.0)
* (90, 14.2)
* (100, 14.5)
* (110, 14.8)
* (120, 15.1)
* (130, 15.3)
* (140, 15.5)
**Random Comp Avg@32 (Teal Line):**
The teal line also shows an upward trend, but it plateaus earlier than the red line. It starts at approximately 4.0% accuracy at 0 training steps. The line increases rapidly initially, then levels off around 11-12% accuracy.
* (0, 4.0)
* (10, 8.5)
* (20, 9.5)
* (30, 10.4)
* (40, 10.8)
* (50, 11.1)
* (60, 11.3)
* (70, 11.4)
* (80, 11.5)
* (90, 11.6)
* (100, 11.7)
* (110, 11.6)
* (120, 11.4)
* (130, 11.2)
* (140, 11.0)
### Key Observations
* The "Target Comp Avg@32" consistently outperforms the "Random Comp Avg@32" throughout the training process.
* The "Random Comp Avg@32" reaches a plateau in accuracy around 11-12% after approximately 60 training steps, while the "Target Comp Avg@32" continues to improve, albeit at a decreasing rate.
* Both lines show a steep initial increase in accuracy, suggesting rapid learning in the early stages of training.
### Interpretation
The data suggests that a targeted competition approach ("Target Comp Avg@32") is more effective than a random competition approach ("Random Comp Avg@32") in improving average accuracy during training. The targeted approach demonstrates sustained improvement over a longer period, achieving a higher final accuracy. The plateau observed in the random competition approach indicates that it may reach a limit in its learning capacity or that further training does not yield significant gains. This could be due to the random approach exploring a less optimal search space or getting stuck in local optima. The initial rapid increase in both lines suggests that both approaches benefit from early training, but the targeted approach is better at capitalizing on continued training. The difference in performance highlights the importance of strategic competition design in optimizing training outcomes.