## Scatter Plot with Fitted Curves: Competition Level Accuracy (%)
### Overview
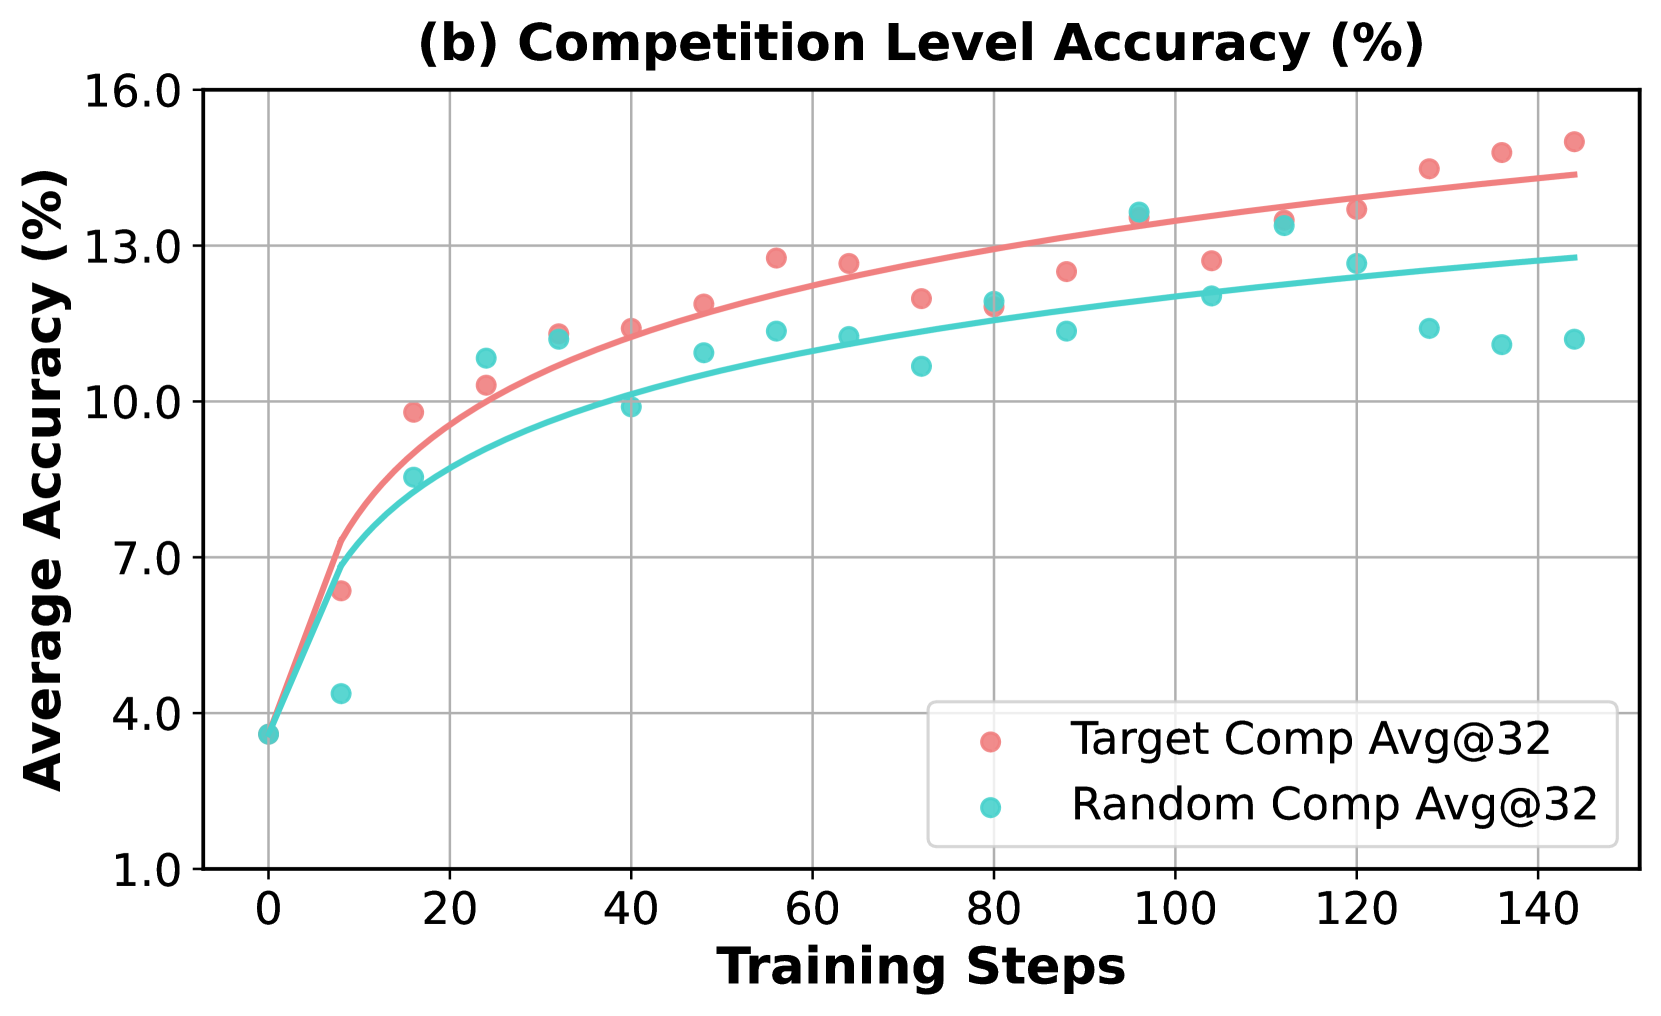
The image is a scatter plot chart titled "(b) Competition Level Accuracy (%)". It displays the performance of two different methods over the course of training, measured by average accuracy percentage. The chart includes individual data points and fitted trend lines for each method, showing how accuracy evolves as training progresses.
### Components/Axes
* **Chart Title:** "(b) Competition Level Accuracy (%)" (centered at the top).
* **X-Axis:** Labeled "Training Steps". The scale runs from 0 to 140, with major tick marks at intervals of 20 (0, 20, 40, 60, 80, 100, 120, 140).
* **Y-Axis:** Labeled "Average Accuracy (%)". The scale runs from 1.0 to 16.0, with major tick marks at 1.0, 4.0, 7.0, 10.0, 13.0, and 16.0.
* **Legend:** Located in the bottom-right quadrant of the chart area. It contains two entries:
* A pink/salmon-colored circle marker labeled "Target Comp Avg@32".
* A teal/cyan-colored circle marker labeled "Random Comp Avg@32".
* **Data Series:** Two series of scatter points, each with a corresponding fitted trend line.
* **Series 1 (Pink):** "Target Comp Avg@32". Data points are pink circles. The fitted line is a smooth, solid pink curve.
* **Series 2 (Teal):** "Random Comp Avg@32". Data points are teal circles. The fitted line is a smooth, solid teal curve.
* **Grid:** A light gray grid is present, with lines corresponding to the major ticks on both axes.
### Detailed Analysis
**Data Series: Target Comp Avg@32 (Pink)**
* **Trend Verification:** The pink trend line shows a steep initial increase that gradually flattens, exhibiting a logarithmic growth pattern. It consistently remains above the teal line after the initial steps.
* **Approximate Data Points (Training Step, Accuracy %):**
* (0, ~3.5)
* (10, ~6.5)
* (20, ~9.8)
* (30, ~10.2)
* (40, ~11.5)
* (50, ~11.8)
* (60, ~12.8)
* (70, ~12.7)
* (80, ~12.0)
* (90, ~12.5)
* (100, ~12.8)
* (110, ~13.5)
* (120, ~13.8)
* (130, ~14.5)
* (140, ~15.0)
* (145, ~15.2) - Final point, slightly beyond the 140 tick.
**Data Series: Random Comp Avg@32 (Teal)**
* **Trend Verification:** The teal trend line also shows a steep initial increase that flattens, but it plateaus at a lower accuracy level than the pink line. The slope is less steep than the pink line after the initial phase.
* **Approximate Data Points (Training Step, Accuracy %):**
* (0, ~3.5)
* (10, ~4.5)
* (20, ~8.5)
* (30, ~10.8)
* (40, ~11.2)
* (50, ~10.0)
* (60, ~11.2)
* (70, ~11.2)
* (80, ~10.5)
* (90, ~11.8)
* (100, ~11.5)
* (110, ~12.0)
* (120, ~13.5)
* (130, ~12.8)
* (140, ~11.5)
* (145, ~11.2) - Final point, slightly beyond the 140 tick.
### Key Observations
1. **Performance Gap:** The "Target Comp Avg@32" method (pink) achieves and maintains a higher average accuracy than the "Random Comp Avg@32" method (teal) for nearly all training steps after the very beginning.
2. **Convergence and Plateau:** Both methods show rapid improvement in the first 20-40 training steps, after which the rate of improvement slows significantly. The pink line appears to still be slightly increasing at step 145, while the teal line shows signs of plateauing or even slight decline after step 120.
3. **Variability:** The "Random Comp Avg@32" (teal) data points show greater scatter or variance around its trend line, especially in the later steps (e.g., points at steps 120, 130, 140, 145). The "Target Comp Avg@32" (pink) points are more tightly clustered around its trend line.
4. **Initial Conditions:** Both methods start at approximately the same accuracy (~3.5%) at step 0.
### Interpretation
This chart demonstrates a comparative analysis of two training strategies or model variants, likely in a machine learning or optimization context. The "Target" method, which may involve focused or guided training, significantly outperforms the "Random" method, which may involve less directed exploration.
The data suggests that while both approaches benefit from initial training, the targeted strategy leads to a higher final performance ceiling and more stable progress. The greater variance in the "Random" method's results indicates less predictable outcomes, which could be a drawback in practical applications. The persistent gap between the two trend lines implies that the advantage gained from the targeted approach is sustained throughout the observed training period and is not merely an early-stage effect. The chart effectively argues for the superiority of the "Target Comp Avg@32" method for maximizing competition-level accuracy within the given training budget.