\n
## Scatter Plot: Confidence vs. Target Length (High School Chemistry)
### Overview
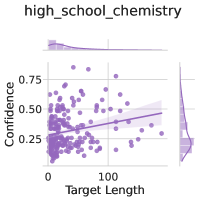
This image presents a scatter plot visualizing the relationship between "Target Length" and "Confidence" for data labeled as "high_school_chemistry". A regression line with a shaded confidence interval is overlaid on the scatter points. The plot suggests a weak negative correlation between target length and confidence.
### Components/Axes
* **Title:** high\_school\_chemistry (top-center)
* **X-axis:** Target Length (bottom-center), ranging from approximately 0 to 120.
* **Y-axis:** Confidence (left-center), ranging from approximately 0.2 to 0.8.
* **Data Points:** Numerous purple dots scattered across the plot area.
* **Regression Line:** A purple line representing the trend of the data.
* **Confidence Interval:** A light purple shaded area around the regression line, indicating the uncertainty in the line's estimate.
* **Histograms:** Two histograms are present at the top and right of the scatter plot, showing the distribution of Target Length and Confidence respectively.
### Detailed Analysis
The scatter plot shows a general trend of decreasing confidence as target length increases, but the relationship is not strong.
* **Regression Line Trend:** The regression line slopes downward, indicating a negative correlation.
* **Data Point Distribution:** The data points are widely dispersed, indicating a high degree of variability.
* **X-axis (Target Length):** The histogram at the top shows a distribution of target lengths. The peak of the distribution appears to be around a target length of 0-20.
* **Y-axis (Confidence):** The histogram on the right shows a distribution of confidence values. The peak of the distribution appears to be around a confidence of 0.3-0.4.
* **Data Points (Approximate Values):**
* At Target Length = 0, Confidence ranges from approximately 0.2 to 0.7.
* At Target Length = 50, Confidence ranges from approximately 0.2 to 0.6.
* At Target Length = 100, Confidence ranges from approximately 0.2 to 0.5.
* At Target Length = 120, Confidence ranges from approximately 0.15 to 0.35.
### Key Observations
* The correlation between target length and confidence is weak.
* There is significant variability in confidence for a given target length.
* The confidence interval around the regression line is relatively wide, indicating a high degree of uncertainty in the estimated relationship.
* The distribution of target lengths is skewed towards lower values.
* The distribution of confidence values is concentrated in the lower range (0.2-0.5).
### Interpretation
The data suggests that, for the "high\_school\_chemistry" dataset, there is a slight tendency for confidence to decrease as the target length increases. However, this relationship is not strong, and other factors likely play a significant role in determining confidence. The wide confidence interval indicates that the observed relationship may not generalize well to other datasets. The skewed distribution of target lengths suggests that the model may be more accurate for shorter target lengths. The data could be related to a question answering or text generation task, where "target length" refers to the length of the answer or generated text, and "confidence" represents the model's certainty in its response. The negative correlation might indicate that the model struggles to generate confident responses for longer, more complex targets. The histograms provide insight into the distribution of the input features (target length) and the output variable (confidence).