\n
## Line Chart: CIFAR-10 Test Accuracy vs. d₁
### Overview
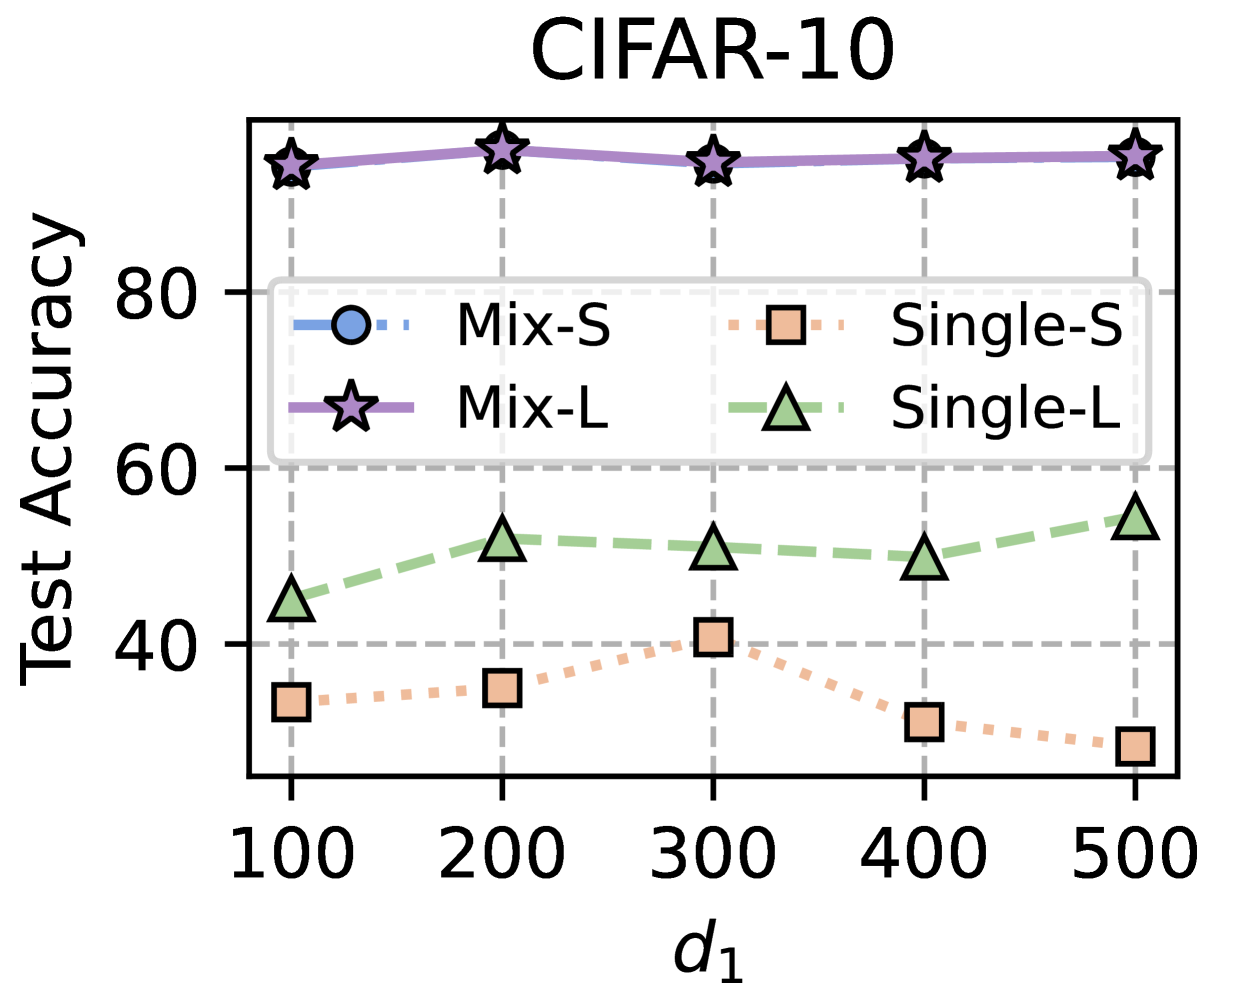
The image is a line chart titled "CIFAR-10," plotting "Test Accuracy" against a parameter labeled "d₁". It compares the performance of four distinct methods or models: Mix-S, Mix-L, Single-S, and Single-L. The chart shows how the test accuracy of each method changes as the value of d₁ increases from 100 to 500.
### Components/Axes
* **Title:** "CIFAR-10" (centered at the top).
* **Y-axis:** Labeled "Test Accuracy". The scale runs from 40 to 80, with major tick marks and grid lines at 40, 60, and 80. The data for one series extends above the 80 mark.
* **X-axis:** Labeled "d₁". The scale has discrete, evenly spaced values: 100, 200, 300, 400, 500.
* **Legend:** Located in the top-right quadrant of the chart area. It defines four data series:
* `Mix-S`: Blue circle marker with a dash-dot line style.
* `Mix-L`: Purple star marker with a solid line style.
* `Single-S`: Orange square marker with a dotted line style.
* `Single-L`: Green triangle marker with a dashed line style.
* **Grid:** Dashed grey grid lines are present for both the x and y axes.
### Detailed Analysis
The chart displays the following trends and approximate data points for each series:
1. **Mix-L (Purple star, solid line):**
* **Trend:** This series is positioned at the top of the chart and exhibits a very stable, high accuracy with minimal fluctuation across all d₁ values. The line is nearly flat.
* **Data Points (Approximate):**
* d₁=100: ~92%
* d₁=200: ~94%
* d₁=300: ~93%
* d₁=400: ~93%
* d₁=500: ~94%
2. **Single-L (Green triangle, dashed line):**
* **Trend:** This series is in the middle range of the chart. It shows a general, slight upward trend as d₁ increases, with a small dip around d₁=400.
* **Data Points (Approximate):**
* d₁=100: ~45%
* d₁=200: ~52%
* d₁=300: ~51%
* d₁=400: ~50%
* d₁=500: ~55%
3. **Single-S (Orange square, dotted line):**
* **Trend:** This series is in the lower range of the chart. It shows an initial increase, peaking at d₁=300, followed by a clear decline as d₁ increases further.
* **Data Points (Approximate):**
* d₁=100: ~33%
* d₁=200: ~35%
* d₁=300: ~41%
* d₁=400: ~31%
* d₁=500: ~28%
4. **Mix-S (Blue circle, dash-dot line):**
* **CRITICAL OBSERVATION:** Although `Mix-S` is defined in the legend, **no corresponding blue circle markers or dash-dot line are visible on the chart**. This series appears to be missing from the plot.
### Key Observations
* **Performance Hierarchy:** There is a clear and consistent separation in performance. `Mix-L` significantly outperforms all other methods, maintaining accuracy above 90%. `Single-L` performs in the 45-55% range, while `Single-S` performs the worst, generally below 40%.
* **Stability vs. Sensitivity:** `Mix-L` is highly stable with respect to the parameter d₁. In contrast, `Single-S` is highly sensitive, showing a performance peak at d₁=300 before degrading. `Single-L` shows moderate sensitivity with a slight positive trend.
* **Missing Data:** The absence of the `Mix-S` data series is a major anomaly. It is unclear if this method was not evaluated, if its performance was off the chart scale, or if there is a plotting error.
* **Scale:** The y-axis is labeled up to 80, but the `Mix-L` data points are clearly above this line, suggesting the actual accuracy values are in the low-to-mid 90s.
### Interpretation
This chart likely compares different training or architectural strategies (denoted by "Mix" vs. "Single" and "S" vs. "L") for a machine learning model on the CIFAR-10 image classification task. The parameter `d₁` could represent a dimension, such as the width of a layer or a latent space size.
The data suggests that the "Mix-L" strategy is by far the most effective and robust, delivering high accuracy that is largely unaffected by changes in `d₁` within the tested range. The "Single" strategies are less effective, with "Single-L" (likely a larger model) outperforming "Single-S" (likely a smaller model). The peaking behavior of "Single-S" indicates there is an optimal value for `d₁` around 300 for that specific configuration, beyond which performance suffers, possibly due to overfitting or optimization difficulties.
The most significant finding is the missing `Mix-S` series. Its absence prevents a complete comparison. If it performed poorly, it would reinforce the superiority of the "Mix-L" approach. If it performed well but was omitted, it would represent a critical gap in the presented results. A viewer must conclude that either the experiment for `Mix-S` failed, the data was lost, or the chart is incomplete.