## Line Chart: Percentage of Negative Objects vs. Epochs
### Overview
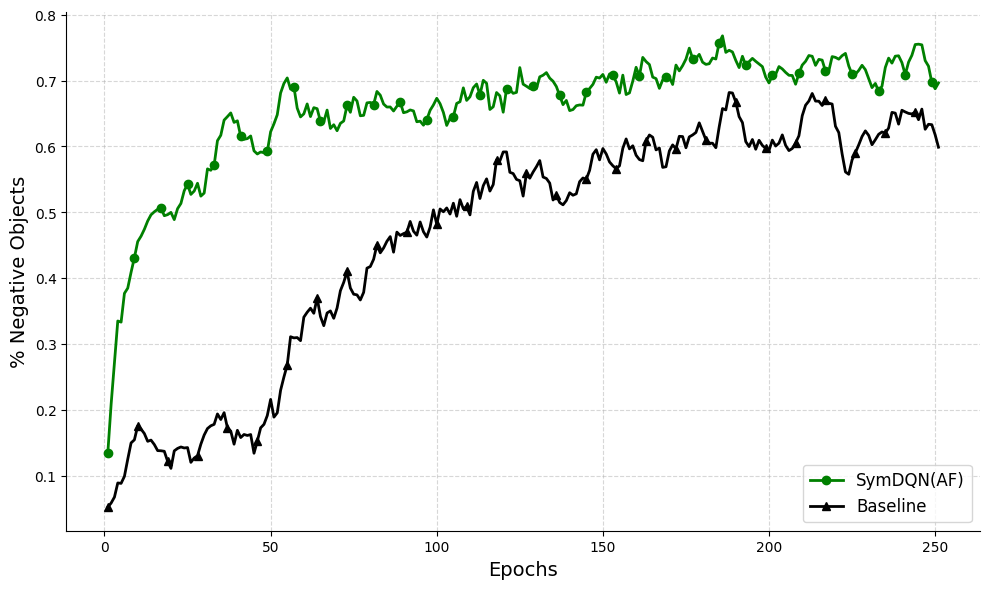
The image is a line chart comparing the performance of two models, "SymDQN(AF)" and "Baseline," over 250 epochs. The y-axis represents the percentage of negative objects, ranging from 0% to 80%. The x-axis represents the number of epochs, ranging from 0 to 250. The chart shows how the percentage of negative objects changes for each model as the training progresses.
### Components/Axes
* **X-axis:** Epochs, ranging from 0 to 250 in increments of 50.
* **Y-axis:** % Negative Objects, ranging from 0 to 0.8 (80%) in increments of 0.1 (10%).
* **Legend:** Located in the bottom-right corner.
* **SymDQN(AF):** Represented by a green line with circle markers.
* **Baseline:** Represented by a black line with triangle markers.
* **Grid:** The chart has a light gray grid in the background.
### Detailed Analysis
* **SymDQN(AF) (Green Line):**
* **Trend:** The green line starts at approximately 14% at epoch 0, rapidly increases to approximately 50% by epoch 25, and then continues to increase, albeit at a slower rate, reaching approximately 65% by epoch 50. It fluctuates between 65% and 75% from epoch 50 to epoch 250.
* **Data Points:**
* Epoch 0: ~14%
* Epoch 25: ~50%
* Epoch 50: ~65%
* Epoch 100: ~65%
* Epoch 150: ~70%
* Epoch 200: ~75%
* Epoch 250: ~70%
* **Baseline (Black Line):**
* **Trend:** The black line starts at approximately 5% at epoch 0, increases to approximately 20% by epoch 50, and then continues to increase, albeit at a slower rate, reaching approximately 50% by epoch 100. It fluctuates between 50% and 70% from epoch 100 to epoch 250.
* **Data Points:**
* Epoch 0: ~5%
* Epoch 25: ~15%
* Epoch 50: ~20%
* Epoch 100: ~50%
* Epoch 150: ~55%
* Epoch 200: ~68%
* Epoch 250: ~60%
### Key Observations
* The SymDQN(AF) model consistently outperforms the Baseline model in terms of the percentage of negative objects.
* Both models show a significant increase in the percentage of negative objects during the initial epochs, with the SymDQN(AF) model showing a more rapid increase.
* After the initial increase, both models exhibit fluctuations in their performance, but the SymDQN(AF) model maintains a higher percentage of negative objects throughout the training process.
### Interpretation
The chart suggests that the SymDQN(AF) model is more effective at identifying negative objects compared to the Baseline model. The rapid initial increase in the percentage of negative objects for both models indicates that they are learning to identify these objects early in the training process. The fluctuations in performance after the initial increase may be due to the models encountering more challenging examples or overfitting to the training data. Overall, the SymDQN(AF) model demonstrates superior performance in this task.