## Table: Sparkling Smiles Clinic Ratio Analysis
### Overview
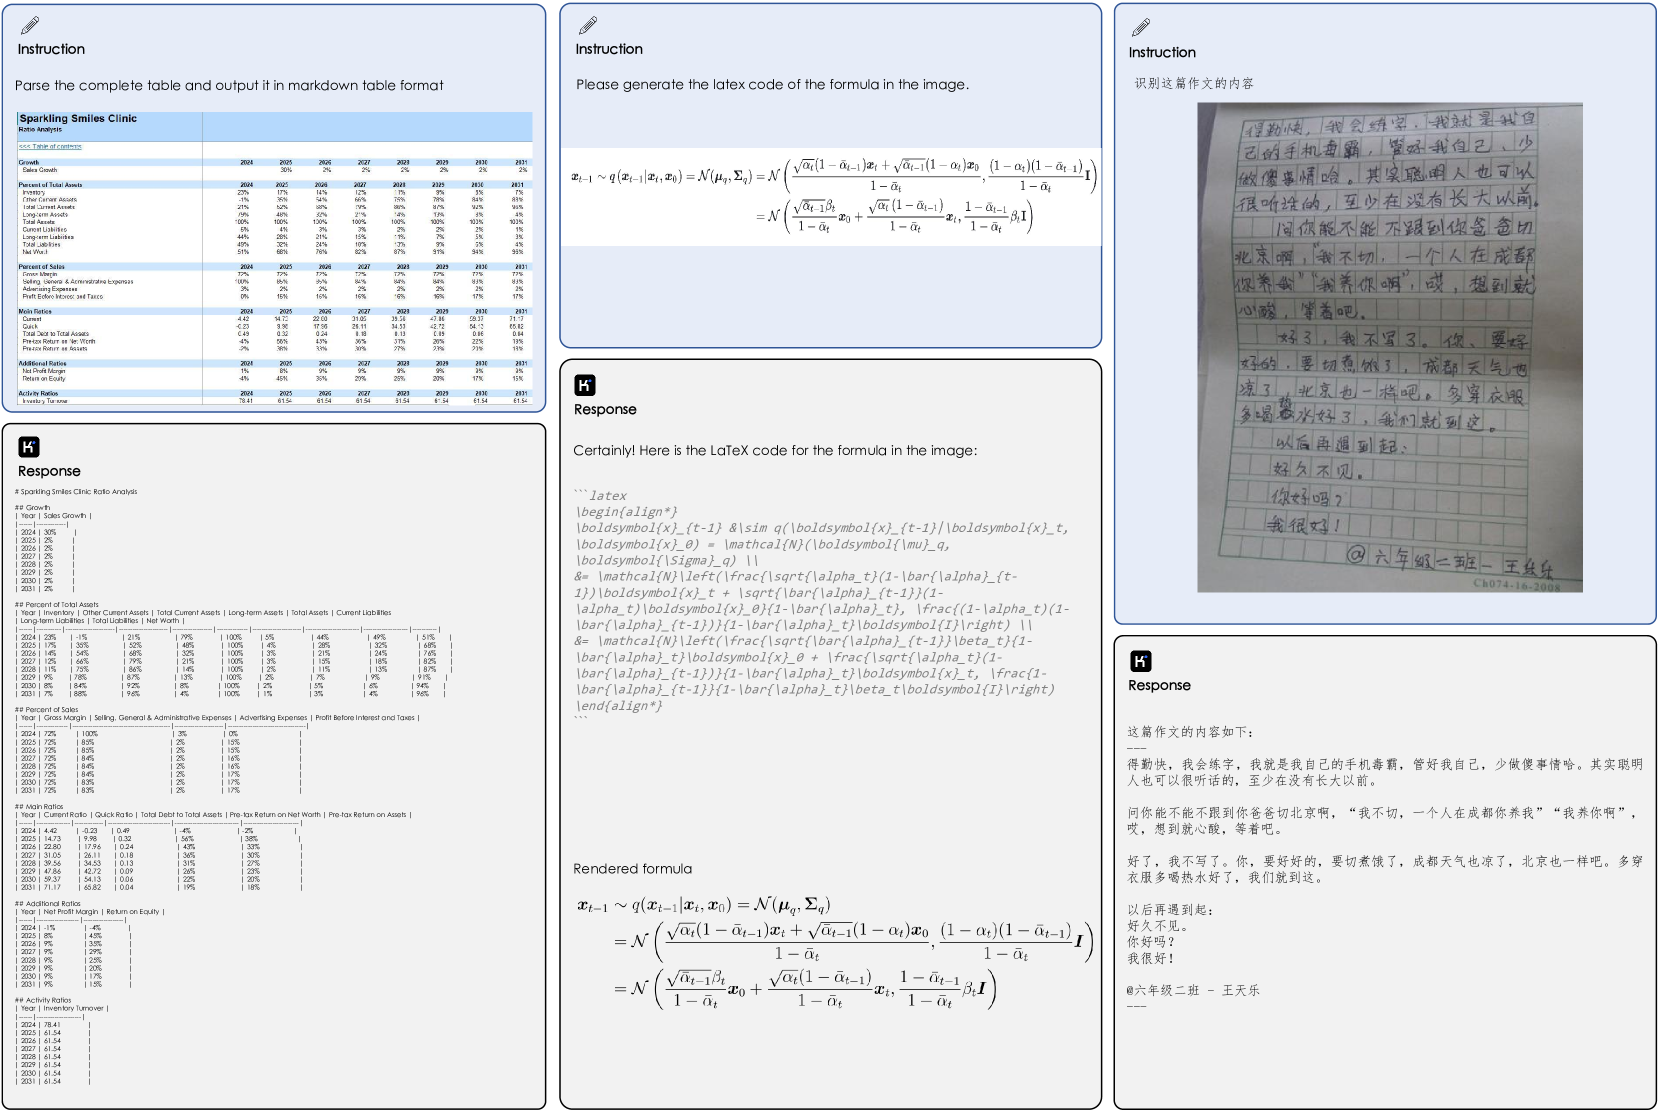
The image presents a financial ratio analysis for Sparkling Smiles Clinic, covering the years 2024 to 2031. The analysis includes growth rates, percentage of total assets, percentage of sales, main ratios, additional ratios, and activity ratios. The data is presented in a tabular format.
### Components/Axes
* **Title:** Sparkling Smiles Clinic Ratio Analysis
* **Sections:**
* Growth
* Percent of Total Assets
* Percent of Sales
* Main Ratios
* Additional Ratios
* Activity Ratios
* **Years:** 2024, 2025, 2026, 2027, 2028, 2029, 2030, 2031
* **Growth:** Sales Growth (%)
* **Percent of Total Assets:** Inventory, Other Current Assets, Total Current Assets, Long-term Assets, Total Assets, Current Liabilities, Long-term Liabilities, Total Liabilities, Net Worth
* **Percent of Sales:** Gross Margin, Selling, General & Administrative Expenses, Advertising Expenses, Profit Before Interest and Taxes
* **Main Ratios:** Current Ratio, Quick Ratio, Total Debt to Total Assets, Pre-tax Return on Net Worth, Pre-tax Return on Assets
* **Additional Ratios:** Net Profit Margin, Return on Equity
* **Activity Ratios:** Inventory Turnover
### Detailed Analysis or ### Content Details
**Growth**
| Year | Sales Growth (%) |
|---|---|
| 2024 | 30% |
| 2025 | 2% |
| 2026 | 2% |
| 2027 | 1% |
| 2028 | 2% |
| 2029 | 2% |
| 2030 | 2% |
| 2031 | 2% |
**Percent of Total Assets**
| Year | Inventory | Other Current Assets | Total Current Assets | Long-term Assets | Total Assets | Current Liabilities | Long-term Liabilities | Total Liabilities | Net Worth |
|---|---|---|---|---|---|---|---|---|---|
| 2024 | 23% | 21% | 79% | 100% | 5% | 44% | 1% | 45% | 51% |
| 2025 | 14% | 54% | 68% | 32% | 100% | 3% | 21% | 24% | 76% |
| 2026 | 11% | 75% | 86% | 14% | 100% | 2% | 11% | 13% | 87% |
| 2027 | 8% | 84% | 92% | 8% | 100% | 2% | 1% | 3% | 97% |
| 2028 | 8% | 84% | 92% | 8% | 100% | 2% | 1% | 3% | 97% |
| 2029 | 8% | 84% | 92% | 8% | 100% | 2% | 1% | 3% | 97% |
| 2030 | 8% | 84% | 92% | 8% | 100% | 2% | 1% | 3% | 97% |
| 2031 | 8% | 84% | 92% | 8% | 100% | 2% | 1% | 3% | 97% |
**Percent of Sales**
| Year | Gross Margin | Selling, General & Administrative Expenses | Advertising Expenses | Profit Before Interest and Taxes |
|---|---|---|---|---|
| 2024 | 72% | 100% | 4% | 1% |
| 2025 | 72% | 8% | 2% | 12% |
| 2026 | 72% | 8% | 2% | 12% |
| 2027 | 72% | 8% | 2% | 12% |
| 2028 | 72% | 8% | 2% | 12% |
| 2029 | 72% | 8% | 2% | 12% |
| 2030 | 72% | 8% | 2% | 12% |
| 2031 | 72% | 8% | 2% | 12% |
**Main Ratios**
| Year | Current Ratio | Quick Ratio | Total Debt to Total Assets | Pre-tax Return on Net Worth | Pre-tax Return on Assets |
|---|---|---|---|---|---|
| 2024 | 4.42 | 0.23 | 0.49 | 4% | 2% |
| 2025 | 14.73 | 9.98 | 0.32 | 54% | 30% |
| 2026 | 28.11 | 18.13 | 0.18 | 30% | 15% |
| 2027 | 39.05 | 26.11 | 0.08 | 30% | 15% |
| 2028 | 47.86 | 31.53 | 0.08 | 30% | 15% |
| 2029 | 47.86 | 42.72 | 0.08 | 26% | 18% |
| 2030 | 54.13 | 34.53 | 0.08 | 23% | 18% |
| 2031 | 71.17 | 65.82 | 0.04 | 19% | 18% |
**Additional Ratios**
| Year | Net Profit Margin | Return on Equity |
|---|---|---|
| 2024 | 2% | 4% |
| 2025 | 30% | 54% |
| 2026 | 15% | 30% |
| 2027 | 15% | 30% |
| 2028 | 15% | 30% |
| 2029 | 18% | 26% |
| 2030 | 18% | 23% |
| 2031 | 18% | 19% |
**Activity Ratios**
| Year | Inventory Turnover |
|---|---|
| 2024 | 38.41 |
| 2025 | 61.54 |
| 2026 | 61.54 |
| 2027 | 61.54 |
| 2028 | 61.54 |
| 2029 | 61.54 |
| 2030 | 61.54 |
| 2031 | 61.54 |
### Key Observations
* Sales growth starts at 30% in 2024 and decreases to 2% from 2025 onwards.
* Total Current Assets are a high percentage of Total Assets.
* Gross Margin remains constant at 72% from 2024 to 2031.
* Current Ratio and Quick Ratio increase significantly over the years.
* Total Debt to Total Assets decreases over the years.
### Interpretation
The data suggests that Sparkling Smiles Clinic anticipates a significant initial sales growth, which then stabilizes. The high percentage of Total Current Assets indicates a focus on short-term assets. The increasing Current and Quick Ratios suggest improved liquidity. The decreasing Total Debt to Total Assets indicates a reduction in financial leverage. The constant Gross Margin implies stable pricing and cost management.