\n
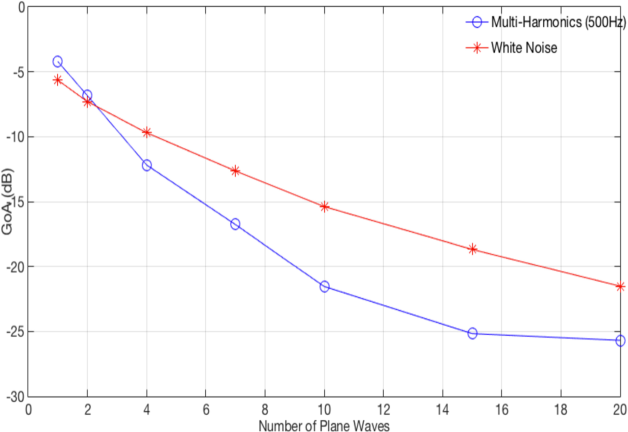
## Chart: GoA(dB) vs. Number of Plane Waves for Multi-Harmonics and White Noise
### Overview
The image presents a line graph comparing the Gain-over-Amplitude (GoA) in decibels (dB) for two signal types – Multi-Harmonics (500Hz) and White Noise – as a function of the Number of Plane Waves. The graph illustrates how the GoA decreases for both signal types as the number of plane waves increases.
### Components/Axes
* **X-axis:** Number of Plane Waves, ranging from 0 to 20, with markers at integer values.
* **Y-axis:** GoA (dB), ranging from -30 dB to 0 dB, with markers at 5 dB intervals.
* **Legend:** Located in the top-right corner.
* Blue line with circle markers: Multi-Harmonics (500Hz)
* Red line with cross markers: White Noise
* **Gridlines:** Present to aid in reading values.
### Detailed Analysis
**Multi-Harmonics (500Hz) - Blue Line:**
The blue line exhibits a consistent downward trend, indicating a decrease in GoA as the number of plane waves increases.
* At 0 Plane Waves: Approximately -1.5 dB.
* At 2 Plane Waves: Approximately -6 dB.
* At 4 Plane Waves: Approximately -11 dB.
* At 6 Plane Waves: Approximately -16 dB.
* At 8 Plane Waves: Approximately -20 dB.
* At 10 Plane Waves: Approximately -23 dB.
* At 12 Plane Waves: Approximately -25 dB.
* At 14 Plane Waves: Approximately -26 dB.
* At 16 Plane Waves: Approximately -26 dB.
* At 18 Plane Waves: Approximately -26 dB.
* At 20 Plane Waves: Approximately -27 dB.
**White Noise - Red Line:**
The red line also shows a downward trend, but it is less steep than the blue line.
* At 0 Plane Waves: Approximately -3 dB.
* At 2 Plane Waves: Approximately -7 dB.
* At 4 Plane Waves: Approximately -10 dB.
* At 6 Plane Waves: Approximately -13 dB.
* At 8 Plane Waves: Approximately -15 dB.
* At 10 Plane Waves: Approximately -17 dB.
* At 12 Plane Waves: Approximately -19 dB.
* At 14 Plane Waves: Approximately -21 dB.
* At 16 Plane Waves: Approximately -22 dB.
* At 18 Plane Waves: Approximately -23 dB.
* At 20 Plane Waves: Approximately -24 dB.
### Key Observations
* The Multi-Harmonics signal consistently exhibits a higher GoA than White Noise across all tested numbers of plane waves.
* The rate of GoA decrease is more pronounced for Multi-Harmonics than for White Noise.
* Both signals show diminishing returns in GoA reduction as the number of plane waves increases beyond 16.
### Interpretation
The data suggests that increasing the number of plane waves reduces the GoA for both Multi-Harmonics and White Noise signals. This could be due to increased interference and signal cancellation as more waves are introduced. The higher GoA for Multi-Harmonics indicates that this signal is less susceptible to reduction by increasing the number of plane waves compared to White Noise. This difference could be attributed to the coherent nature of the Multi-Harmonics signal versus the random nature of White Noise. The flattening of the curves at higher plane wave numbers suggests a limit to the effectiveness of this technique for GoA reduction. The graph demonstrates a trade-off between the number of plane waves and the resulting GoA, and the optimal number of plane waves would depend on the specific application and desired GoA level.