## Bar Chart: Power Consumption, Area, and Latency Comparison
### Overview
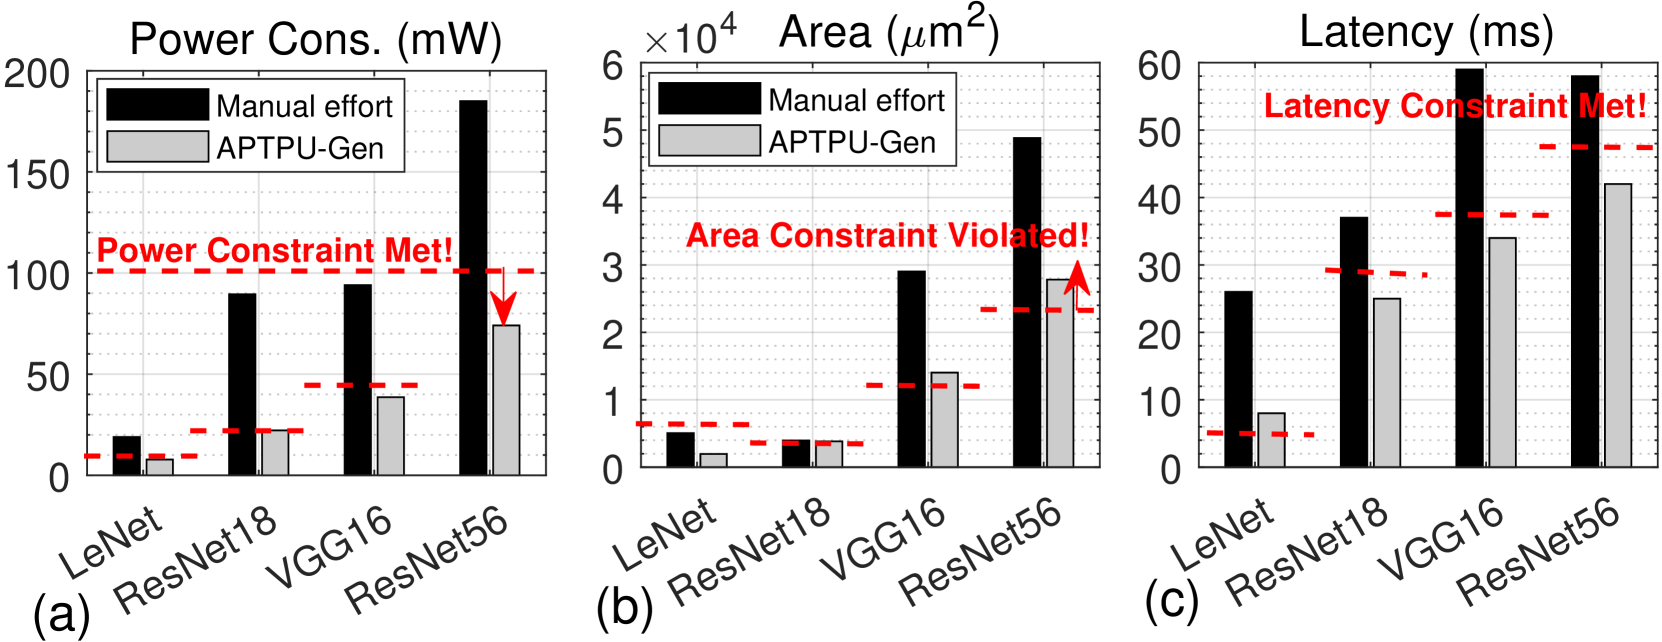
The image presents three bar charts comparing the power consumption, area, and latency of different neural network architectures (LeNet, ResNet18, VGG16, and ResNet56) using manual effort versus an automated approach (APTPU-Gen). Each chart also indicates whether a constraint (power, area, latency) was met or violated.
### Components/Axes
* **Chart Titles:**
* (a) Power Cons. (mW)
* (b) Area (µm²)
* (c) Latency (ms)
* **Y-Axes:**
* Power Consumption: Scale from 0 to 200 mW, incrementing by 50 mW.
* Area: Scale from 0 to 6 x 10^4 µm², incrementing by 1 x 10^4 µm².
* Latency: Scale from 0 to 60 ms, incrementing by 10 ms.
* **X-Axes:**
* Categories: LeNet, ResNet18, VGG16, ResNet56
* **Legend:** Located in the top-left of each chart.
* Black: Manual effort
* Gray: APTPU-Gen
* **Constraints:**
* Power Constraint Met! (Chart a)
* Area Constraint Violated! (Chart b)
* Latency Constraint Met! (Chart c)
### Detailed Analysis
**Chart (a): Power Consumption (mW)**
* **LeNet:**
* Manual effort: ~15 mW
* APTPU-Gen: ~5 mW
* **ResNet18:**
* Manual effort: ~90 mW
* APTPU-Gen: ~25 mW
* **VGG16:**
* Manual effort: ~95 mW
* APTPU-Gen: ~40 mW
* **ResNet56:**
* Manual effort: ~170 mW
* APTPU-Gen: ~80 mW
* **Power Constraint Met!:** A horizontal dashed red line is present at approximately 100 mW, with a downward-pointing arrow indicating that the APTPU-Gen power consumption for ResNet56 is below this constraint. Another dashed red line is present at approximately 25 mW.
**Chart (b): Area (µm²)**
* **LeNet:**
* Manual effort: ~0.4 x 10^4 µm²
* APTPU-Gen: ~0.2 x 10^4 µm²
* **ResNet18:**
* Manual effort: ~0.4 x 10^4 µm²
* APTPU-Gen: ~0.3 x 10^4 µm²
* **VGG16:**
* Manual effort: ~1.5 x 10^4 µm²
* APTPU-Gen: ~1.2 x 10^4 µm²
* **ResNet56:**
* Manual effort: ~5.0 x 10^4 µm²
* APTPU-Gen: ~3.0 x 10^4 µm²
* **Area Constraint Violated!:** A horizontal dashed red line is present at approximately 2.5 x 10^4 µm², with an upward-pointing arrow indicating that the manual effort area for ResNet56 exceeds this constraint. Another dashed red line is present at approximately 0.5 x 10^4 µm².
**Chart (c): Latency (ms)**
* **LeNet:**
* Manual effort: ~8 ms
* APTPU-Gen: ~2 ms
* **ResNet18:**
* Manual effort: ~27 ms
* APTPU-Gen: ~25 ms
* **VGG16:**
* Manual effort: ~35 ms
* APTPU-Gen: ~28 ms
* **ResNet56:**
* Manual effort: ~47 ms
* APTPU-Gen: ~42 ms
* **Latency Constraint Met!:** A horizontal dashed red line is present at approximately 35 ms, indicating that the latency for ResNet56 is below this constraint. Another dashed red line is present at approximately 5 ms.
### Key Observations
* APTPU-Gen consistently results in lower power consumption, area, and latency compared to manual effort across all network architectures.
* The power constraint is met for all architectures using APTPU-Gen.
* The area constraint is violated by the manual effort for ResNet56.
* The latency constraint is met for all architectures.
### Interpretation
The data suggests that the APTPU-Gen automated approach is more efficient than manual effort in terms of power consumption, area, and latency for the tested neural network architectures. The fact that the area constraint is violated by manual effort for ResNet56 highlights the potential benefits of using automated tools for optimizing network design, especially for larger and more complex architectures. The "constraints met" annotations suggest that the APTPU-Gen tool is designed to operate within predefined performance limits.