## Pie Chart: Distribution of Different Categories
### Overview
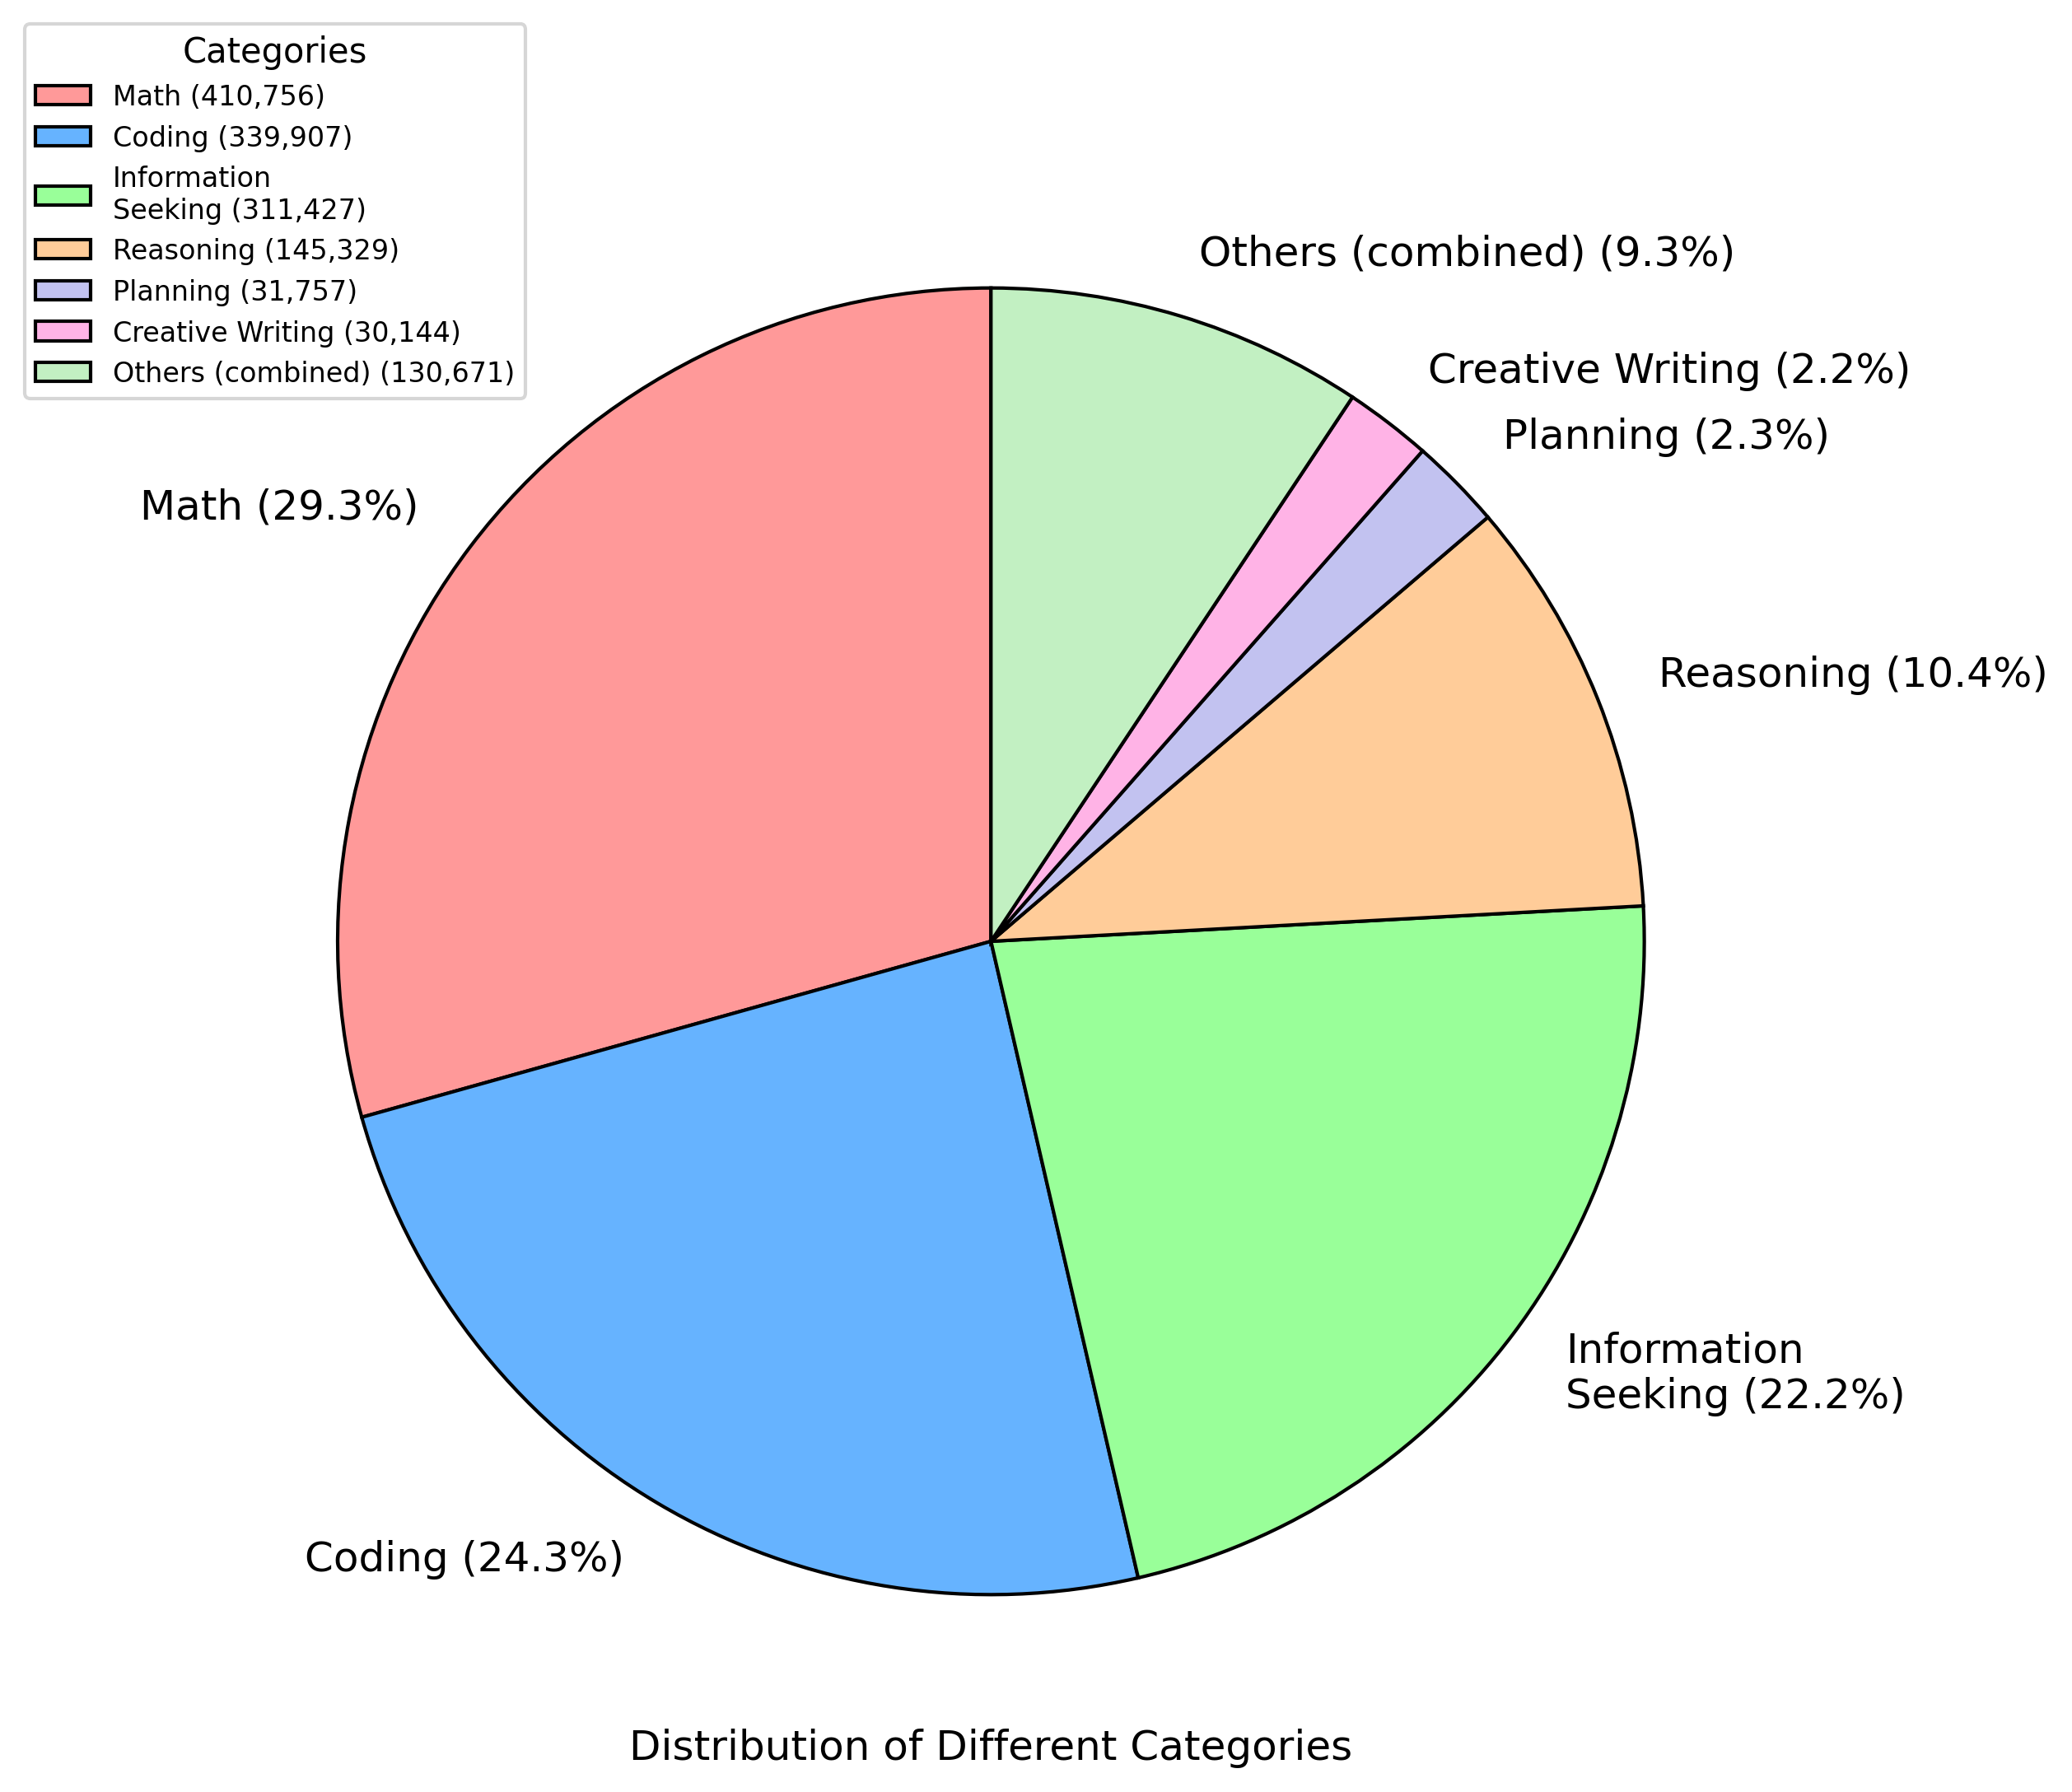
The image displays a pie chart titled "Distribution of Different Categories," visually representing the proportional allocation of seven distinct categories. A legend on the left side maps colors to categories, with numerical values and percentages provided for each. The chart emphasizes the dominance of certain categories while highlighting smaller, less significant segments.
### Components/Axes
- **Legend**: Positioned on the left, the legend includes seven categories with corresponding colors:
- **Math** (Red): 410,756 (29.3%)
- **Coding** (Blue): 339,907 (24.3%)
- **Information Seeking** (Green): 311,427 (22.2%)
- **Reasoning** (Orange): 145,329 (10.4%)
- **Planning** (Purple): 31,757 (2.3%)
- **Creative Writing** (Pink): 30,144 (2.2%)
- **Others (combined)** (Light Green): 130,671 (9.3%)
- **Pie Slices**: Each slice is labeled with the category name and percentage, positioned clockwise starting from the top-left (Math).
### Detailed Analysis
1. **Math (Red)**: Largest slice at 29.3%, occupying nearly 30% of the chart.
2. **Coding (Blue)**: Second-largest at 24.3%, adjacent to Math.
3. **Information Seeking (Green)**: Third-largest at 22.2%, forming a significant portion.
4. **Reasoning (Orange)**: 10.4%, smaller than the top three but still notable.
5. **Planning (Purple)**: 2.3%, a minor segment near the bottom.
6. **Creative Writing (Pink)**: 2.2%, the smallest labeled slice.
7. **Others (combined) (Light Green)**: 9.3%, a moderate-sized slice representing aggregated smaller categories.
### Key Observations
- **Dominance of Core Categories**: Math, Coding, and Information Seeking collectively account for **75.8%** of the total, indicating their critical importance.
- **Smaller Segments**: Planning, Creative Writing, and Others combined make up **13.8%**, with Creative Writing being the smallest individual category.
- **Color Consistency**: All legend colors match their corresponding slices without discrepancies.
### Interpretation
The data suggests a strong emphasis on technical and analytical skills (Math, Coding, Information Seeking), which dominate the distribution. Reasoning represents a mid-tier category, while Planning and Creative Writing are underrepresented. The "Others" category, though aggregated, still constitutes a non-negligible 9.3%, potentially indicating a diverse range of less common categories. The chart highlights a clear hierarchy in priorities, with the top three categories driving the majority of the distribution. This could reflect resource allocation, user behavior, or focus areas in a specific domain (e.g., education, software development, or content creation). The minimal representation of Creative Writing and Planning might signal areas for growth or underinvestment.