## Line Charts: Llama-3.2-1B and Llama-3.2-3B Performance
### Overview
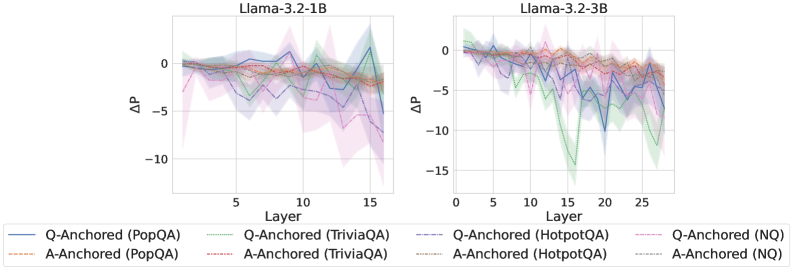
The image contains two line charts comparing the performance of Llama-3.2-1B and Llama-3.2-3B models across different layers. The y-axis represents ΔP (Delta P), and the x-axis represents the Layer number. Each chart displays six data series, representing Q-Anchored and A-Anchored performance on PopQA, TriviaQA, HotpotQA, and NQ datasets. The charts show the change in performance (ΔP) as the layer number increases. Shaded regions around each line indicate the uncertainty or variance in the data.
### Components/Axes
**Left Chart (Llama-3.2-1B):**
* **Title:** Llama-3.2-1B
* **X-axis:** Layer, with markers at 0, 5, 10, and 15.
* **Y-axis:** ΔP, with markers at -10, -5, and 0.
* **Data Series:**
* Q-Anchored (PopQA) - Solid Blue Line
* A-Anchored (PopQA) - Dashed Brown Line
* Q-Anchored (TriviaQA) - Dotted Green Line
* A-Anchored (TriviaQA) - Dash-Dotted Red Line
* Q-Anchored (HotpotQA) - Dash-Dot-Dotted Purple Line
* A-Anchored (NQ) - Dotted Gray Line
**Right Chart (Llama-3.2-3B):**
* **Title:** Llama-3.2-3B
* **X-axis:** Layer, with markers at 0, 5, 10, 15, 20, and 25.
* **Y-axis:** ΔP, with markers at -15, -10, -5, and 0.
* **Data Series:**
* Q-Anchored (PopQA) - Solid Blue Line
* A-Anchored (PopQA) - Dashed Brown Line
* Q-Anchored (TriviaQA) - Dotted Green Line
* A-Anchored (TriviaQA) - Dash-Dotted Red Line
* Q-Anchored (HotpotQA) - Dash-Dot-Dotted Purple Line
* A-Anchored (NQ) - Dotted Gray Line
**Legend:**
Located at the bottom of the image, spanning both charts. It maps line styles and colors to the corresponding data series.
### Detailed Analysis
**Left Chart (Llama-3.2-1B):**
* **Q-Anchored (PopQA):** The blue line starts around 0, fluctuates, and ends near -2.
* **A-Anchored (PopQA):** The brown dashed line starts around -1, fluctuates, and ends near -2.
* **Q-Anchored (TriviaQA):** The green dotted line starts around 0, fluctuates, and ends near -2.
* **A-Anchored (TriviaQA):** The red dash-dotted line starts around -1, fluctuates, and ends near -2.
* **Q-Anchored (HotpotQA):** The purple dash-dot-dotted line starts around -1, fluctuates significantly, and ends near -5.
* **A-Anchored (NQ):** The gray dotted line starts around -1, fluctuates, and ends near -2.
**Right Chart (Llama-3.2-3B):**
* **Q-Anchored (PopQA):** The blue line starts around 0, shows a significant downward trend with a sharp drop around layer 15, and ends near -3.
* **A-Anchored (PopQA):** The brown dashed line starts around 0, fluctuates slightly, and ends near -1.
* **Q-Anchored (TriviaQA):** The green dotted line starts around 0, shows a significant downward trend with a sharp drop around layer 15, and ends near -5.
* **A-Anchored (TriviaQA):** The red dash-dotted line starts around 0, fluctuates slightly, and ends near -1.
* **Q-Anchored (HotpotQA):** The purple dash-dot-dotted line starts around 0, shows a significant downward trend with a sharp drop around layer 15, and ends near -8.
* **A-Anchored (NQ):** The gray dotted line starts around 0, fluctuates slightly, and ends near -1.
### Key Observations
* The Llama-3.2-3B model (right chart) has more layers (up to 28) compared to Llama-3.2-1B (left chart, up to 16).
* The Q-Anchored (HotpotQA) series shows the most significant performance drop in both models, especially in Llama-3.2-3B.
* The shaded regions indicate higher variance in the Q-Anchored (HotpotQA) series compared to other series.
* The A-Anchored (PopQA), A-Anchored (TriviaQA), and A-Anchored (NQ) series show relatively stable performance across layers in both models.
### Interpretation
The charts compare the performance of two Llama models on different question-answering datasets. The ΔP metric likely represents the change in some performance metric (e.g., probability, accuracy) as the model processes information through different layers.
The data suggests that:
* The Llama-3.2-3B model, with its increased number of layers, exhibits a more pronounced performance drop in the Q-Anchored (HotpotQA) series, indicating that the increased depth may not be beneficial for this specific task.
* The A-Anchored series generally show more stable performance, suggesting that anchoring on the answer might lead to more consistent results across layers.
* The HotpotQA dataset seems to be more challenging for these models, as indicated by the larger performance drops and higher variance.
The performance drop in the Q-Anchored (HotpotQA) series for Llama-3.2-3B could be due to overfitting or the model struggling to maintain relevant information across the increased number of layers. Further investigation would be needed to understand the underlying reasons for these performance differences.