# Technical Document Extraction: Medical Diagnosis Flowchart
## Overview
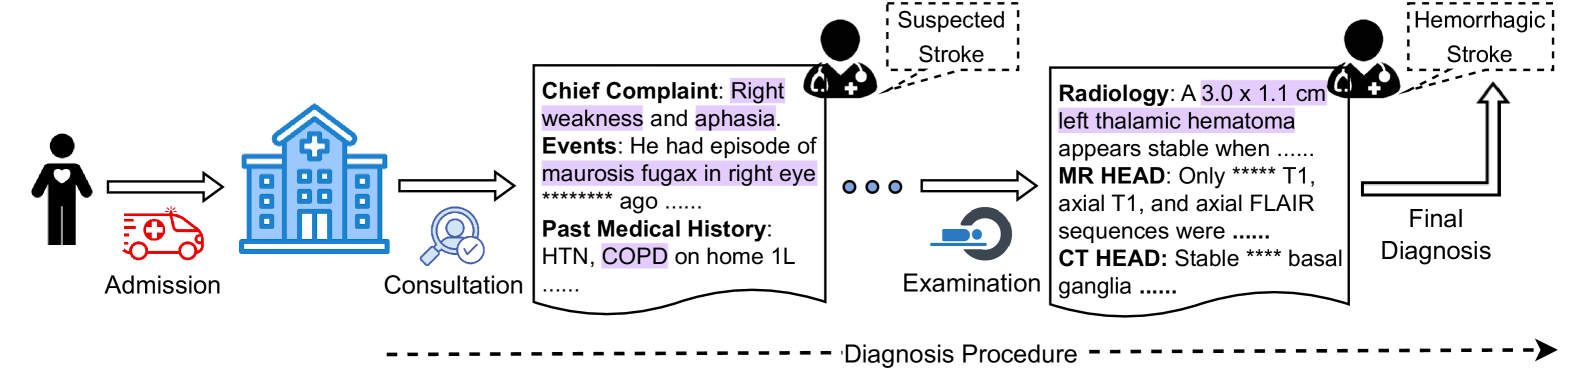
The image depicts a **diagnosis procedure flowchart** for a patient presenting with symptoms suggestive of a hemorrhagic stroke. The process is divided into sequential stages: **Admission**, **Consultation**, **Examination**, and **Final Diagnosis**. Below is a detailed breakdown of components, labels, and textual content.
---
## Key Components and Flow
### 1. **Admission**
- **Visual Elements**:
- **Patient Icon**: Black silhouette with a red heart symbol.
- **Ambulance**: Red vehicle with a white cross (+) and motion lines.
- **Hospital Building**: Blue structure with a white cross (+) and multiple windows.
- **Labels**:
- `Admission` (below ambulance).
- Arrows indicate flow from patient → ambulance → hospital.
### 2. **Consultation**
- **Visual Elements**:
- **Doctor Icon**: Black silhouette with a stethoscope and white cross (+).
- **Magnifying Glass**: Blue icon with a checkmark (✓).
- **Text Box**:
- **Chief Complaint**:
`Right weakness and aphasia.`
*(Highlighted in purple)*
- **Events**:
`He had episode of maurosis fugax in right eye ******* ago.......`
*(Highlighted in purple)*
- **Past Medical History**:
`HTN, COPD on home 1L........`
*(COPD highlighted in purple)*
### 3. **Examination**
- **Visual Elements**:
- **Radiology Report**: Two-column text box with MRI/CT findings.
- **Arrows**: Connect Consultation → Examination.
- **Text Box**:
- **Radiology**:
`A 3.0 x 1.1 cm left thalamic hematoma appears stable when......`
*(Highlighted in purple)*
- **MR HEAD**: `Only ****** T1, axial T1, and axial FLAIR sequences were......`
- **CT HEAD**: `Stable ****** basal ganglia......`
### 4. **Final Diagnosis**
- **Visual Elements**:
- **Doctor Icon**: Same as Consultation.
- **Dashed Box**: Contains `Hemorrhagic Stroke`.
- **Labels**:
- `Final Diagnosis` (below dashed box).
- Arrows indicate flow from Examination → Final Diagnosis.
---
## Flowchart Structure
- **Dashed Line**: Labeled `Diagnosis Procedure` spans the bottom, indicating the overall process.
- **Directionality**: Left-to-right flow with arrows connecting stages.
---
## Critical Observations
1. **Highlighted Text**:
- Purple highlights emphasize key clinical terms:
- `Right weakness and aphasia` (Chief Complaint).
- `maurosis fugax in right eye` (Events).
- `COPD` (Past Medical History).
- `left thalamic hematoma` (Radiology).
- `Stable` (Radiology findings).
2. **Medical Terminology**:
- **HTN**: Hypertension.
- **COPD**: Chronic Obstructive Pulmonary Disease.
- **maurosis fugax**: Transient monocular blindness (TIA-like symptom).
- **FLAIR**: Fluid-Attenuated Inversion Recovery (MRI sequence).
3. **Radiology Findings**:
- **Left Thalamic Hematoma**: Size specified as 3.0 x 1.1 cm.
- **Stability**: Described as "stable" in both MRI and CT scans.
---
## Data Table (Hypothetical Reconstruction)
| Stage | Key Findings |
|----------------|-----------------------------------------------------------------------------|
| Admission | Patient arrives via ambulance; hospital admission initiated. |
| Consultation | Chief Complaint: Right weakness/aphasia. Past History: HTN, COPD. |
| Examination | MRI/CT reveals left thalamic hematoma (3.0 x 1.1 cm), stable on imaging. |
| Final Diagnosis| Hemorrhagic Stroke confirmed. |
---
## Notes
- **Language**: All text is in English. No non-English content detected.
- **Legend**: No explicit legend present; colors (e.g., red for ambulance, blue for hospital) are contextually inferred.
- **Trends**: No numerical trends; flowchart focuses on clinical progression and diagnostic reasoning.
This extraction captures all textual and structural elements critical for understanding the diagnosis workflow.