## Line Graph: Model Performance Metrics Over Training Steps
### Overview
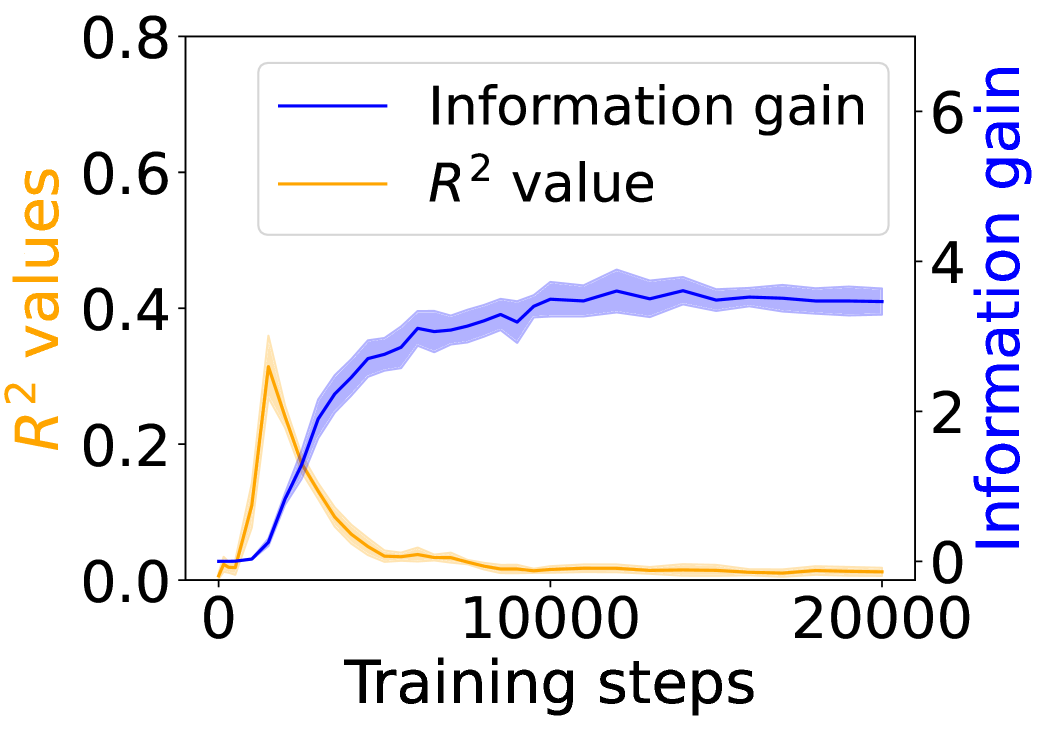
The image depicts a line graph comparing two metrics—**Information gain** and **R² value**—across 20,000 training steps. The graph includes two y-axes: the left axis (orange) tracks R² values (0–0.8), and the right axis (blue) tracks Information gain (0–6). A legend in the top-left corner distinguishes the two metrics by color.
### Components/Axes
- **X-axis**: "Training steps" (0 to 20,000), with markers at 0, 10,000, and 20,000.
- **Left Y-axis**: "R² values" (0–0.8), labeled in orange.
- **Right Y-axis**: "Information gain" (0–6), labeled in blue.
- **Legend**: Top-left corner, with:
- **Blue line**: Information gain.
- **Orange line**: R² value.
### Detailed Analysis
1. **Information gain (blue line)**:
- Starts at 0 at step 0.
- Increases steadily, reaching approximately **4** by 10,000 steps.
- Plateaus slightly above 4 after 10,000 steps, with minor fluctuations.
- Final value at 20,000 steps: ~4.2.
2. **R² value (orange line)**:
- Begins at 0, rises sharply to a peak of **~0.3** at ~5,000 steps.
- Declines sharply after 5,000 steps, dropping to near 0 by 10,000 steps.
- Remains close to 0 for the remainder of training (10,000–20,000 steps).
### Key Observations
- **Divergence of metrics**: R² value peaks early (5,000 steps) and collapses, while Information gain continues to rise.
- **Stability**: Information gain stabilizes after 10,000 steps, suggesting diminishing returns in information acquisition.
- **Anomaly**: R² value’s sharp decline after 5,000 steps contrasts with the sustained growth of Information gain.
### Interpretation
The graph suggests that the model’s **R² value** (a measure of predictive accuracy) improves rapidly during initial training but plateaus and eventually degrades, indicating potential overfitting or saturation. Meanwhile, **Information gain** (a measure of new knowledge acquired) grows steadily, implying that the model continues to learn meaningful patterns even after R² stabilizes. This divergence highlights a trade-off: while R² reflects immediate performance, Information gain may better capture long-term learning dynamics. The sharp drop in R² after 5,000 steps warrants further investigation—it could signal data leakage, noise in the training process, or a mismatch between the model’s capacity and the task complexity.