## Line Chart: MATH Performance Metrics
### Overview
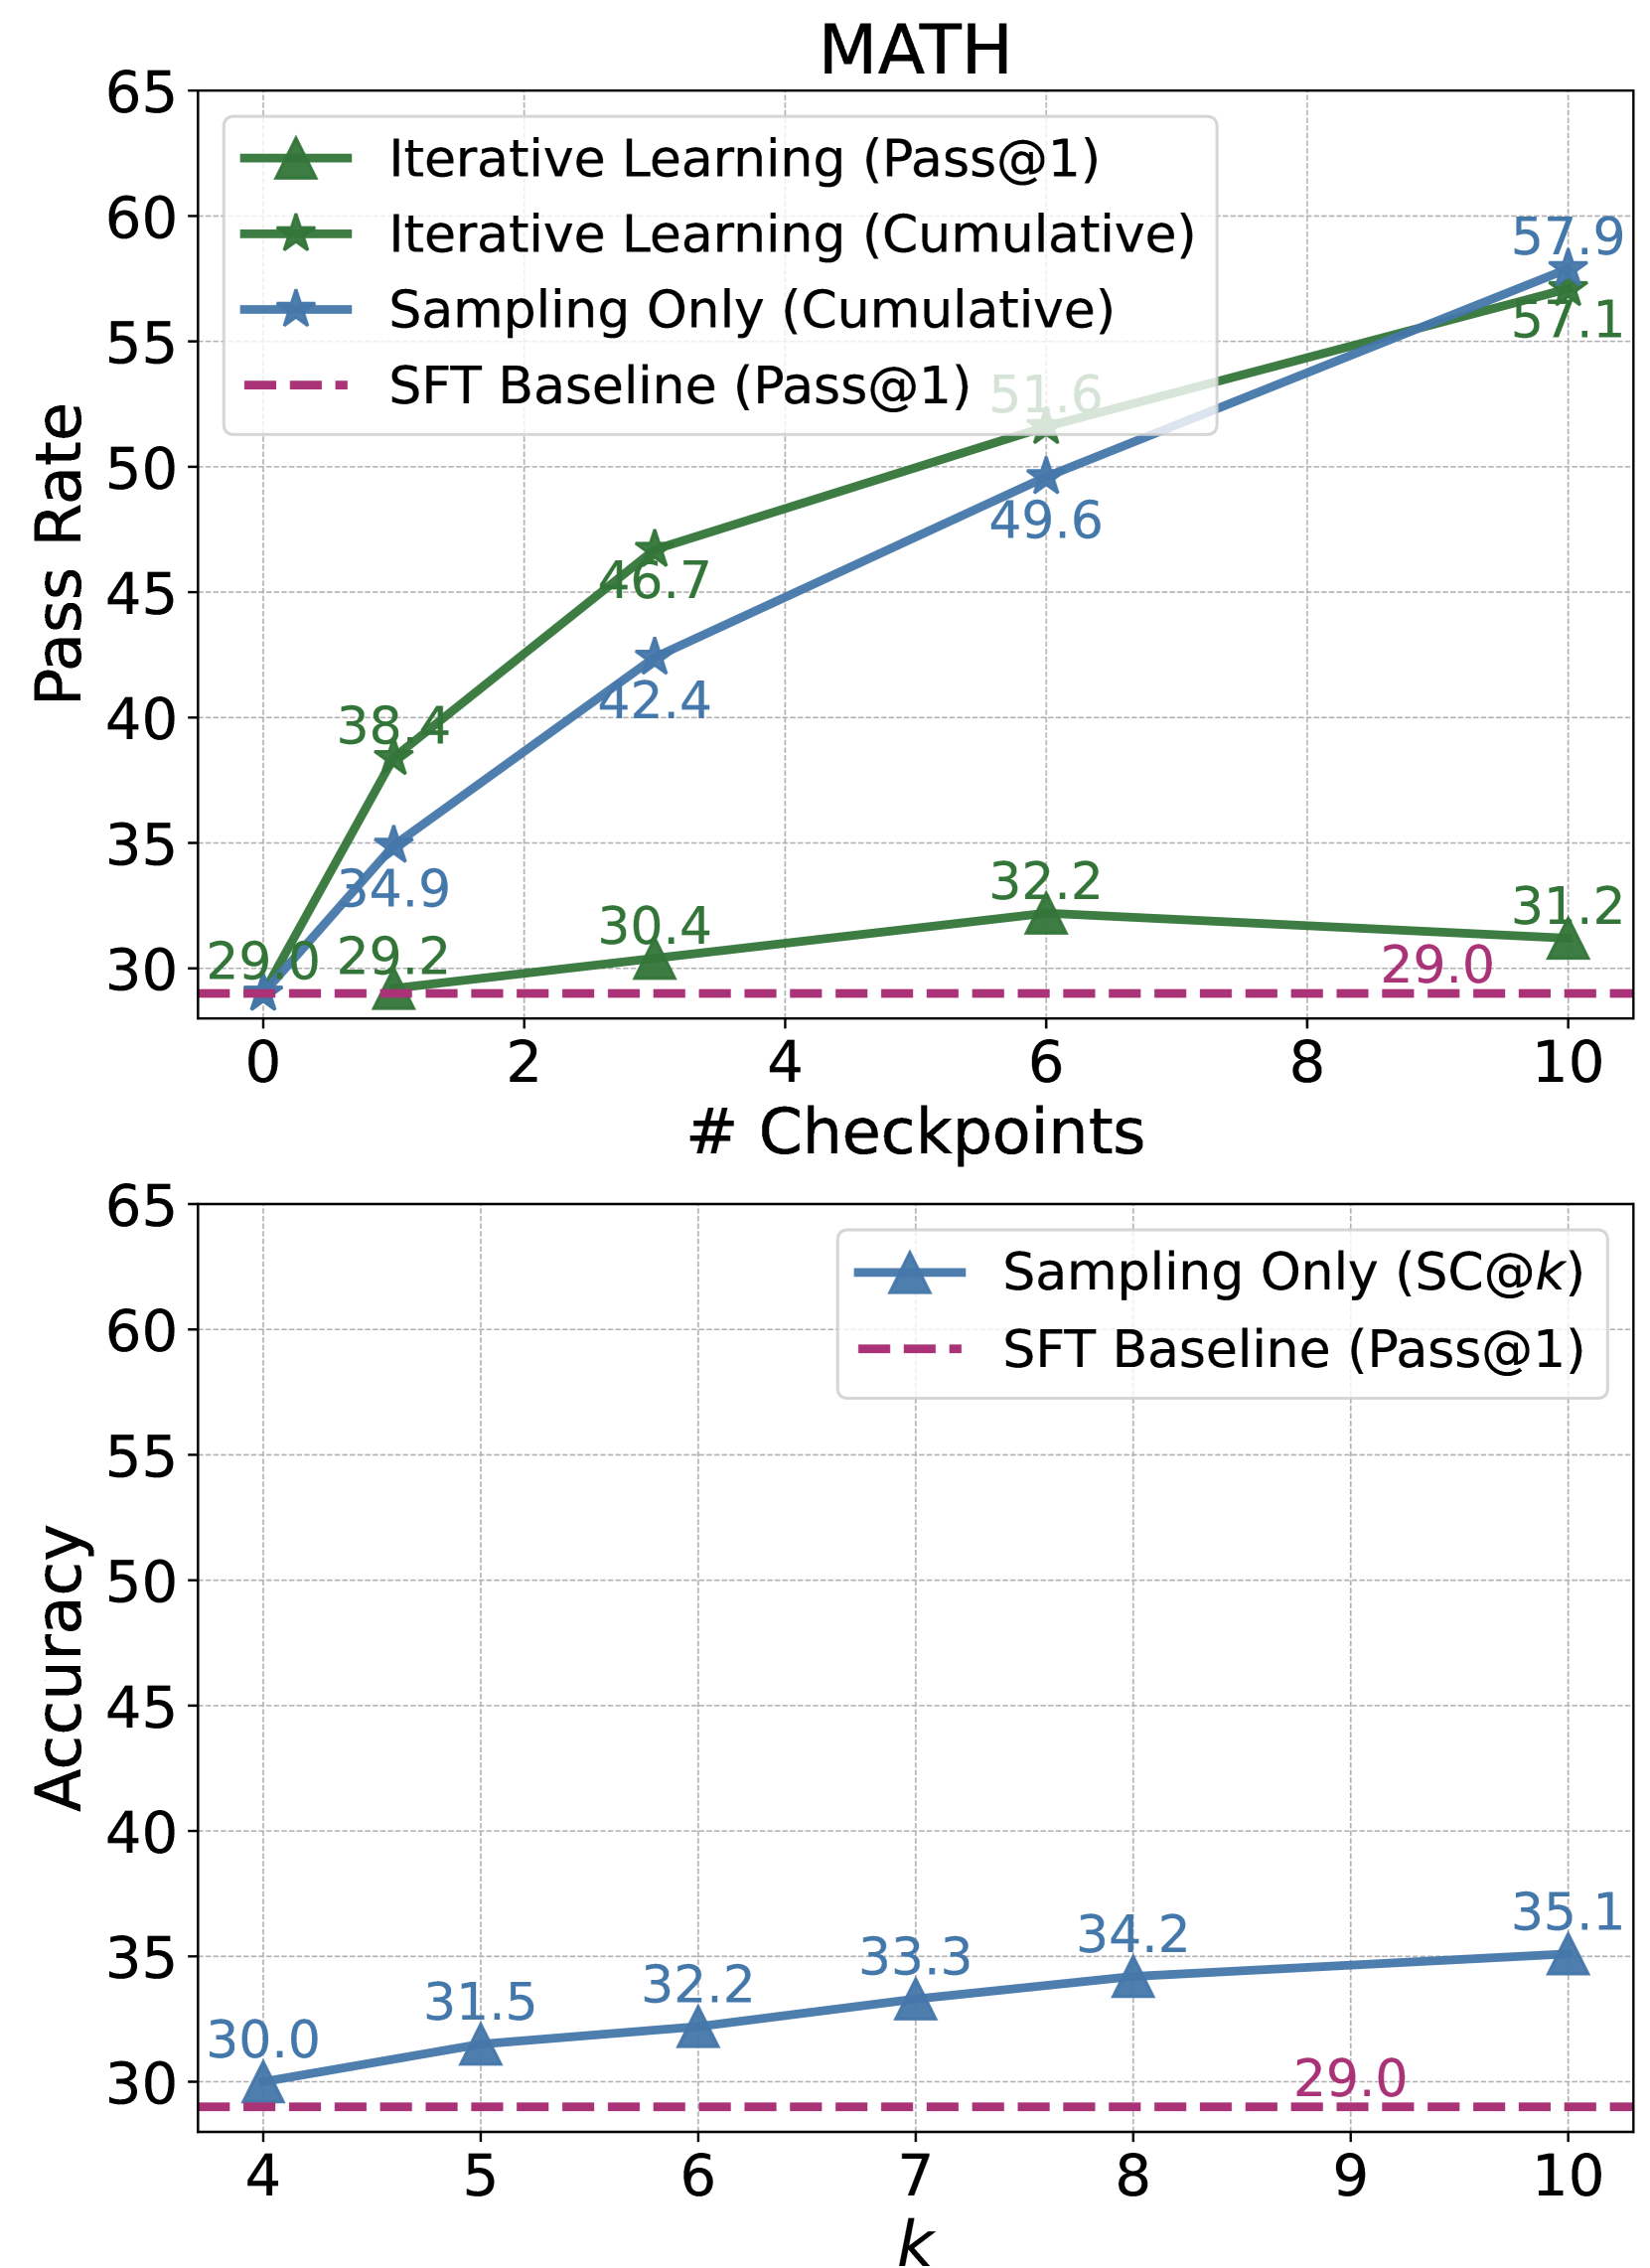
The image displays two line charts under the main title "MATH". The top chart plots "Pass Rate" against the number of checkpoints ("# Checkpoints"). The bottom chart plots "Accuracy" against a variable "k". Both charts compare different learning or sampling methods against a baseline.
### Components/Axes
**Top Chart:**
* **Title:** MATH
* **Y-axis:** Label: "Pass Rate". Scale: 30 to 65, with increments of 5.
* **X-axis:** Label: "# Checkpoints". Scale: 0 to 10, with increments of 2.
* **Legend (Top-Left):**
* `Iterative Learning (Pass@1)`: Green line with upward-pointing triangle markers.
* `Iterative Learning (Cumulative)`: Green line with star markers.
* `Sampling Only (Cumulative)`: Blue line with star markers.
* `SFT Baseline (Pass@1)`: Magenta dashed line.
**Bottom Chart:**
* **Y-axis:** Label: "Accuracy". Scale: 30 to 65, with increments of 5.
* **X-axis:** Label: "k". Scale: 4 to 10, with increments of 1.
* **Legend (Top-Right):**
* `Sampling Only (SC@k)`: Blue line with upward-pointing triangle markers.
* `SFT Baseline (Pass@1)`: Magenta dashed line.
### Detailed Analysis
**Top Chart Data Points & Trends:**
1. **Iterative Learning (Pass@1) [Green, Triangles]:** The line shows a slight upward trend, then plateaus.
* Checkpoint 0: ~29.0
* Checkpoint 1: 29.2
* Checkpoint 3: 30.4
* Checkpoint 6: 32.2
* Checkpoint 10: 31.2
2. **Iterative Learning (Cumulative) [Green, Stars]:** The line shows a strong, consistent upward trend.
* Checkpoint 0: ~29.0
* Checkpoint 1: 38.4
* Checkpoint 3: 46.7
* Checkpoint 6: 51.6
* Checkpoint 10: 57.1
3. **Sampling Only (Cumulative) [Blue, Stars]:** The line shows a strong, consistent upward trend, closely following but slightly below the Iterative Learning (Cumulative) line.
* Checkpoint 0: ~29.0
* Checkpoint 1: 34.9
* Checkpoint 3: 42.4
* Checkpoint 6: 49.6
* Checkpoint 10: 57.9
4. **SFT Baseline (Pass@1) [Magenta, Dashed]:** A flat, horizontal line indicating a constant baseline performance.
* All Checkpoints: 29.0
**Bottom Chart Data Points & Trends:**
1. **Sampling Only (SC@k) [Blue, Triangles]:** The line shows a steady, linear upward trend as k increases.
* k=4: 30.0
* k=5: 31.5
* k=6: 32.2
* k=7: 33.3
* k=8: 34.2
* k=10: 35.1
2. **SFT Baseline (Pass@1) [Magenta, Dashed]:** A flat, horizontal line indicating a constant baseline performance.
* All k values: 29.0
### Key Observations
* **Cumulative vs. Pass@1:** For Iterative Learning, the "Cumulative" metric shows dramatically higher improvement (from ~29 to 57.1) compared to the "Pass@1" metric (from ~29 to 31.2).
* **Method Comparison:** At the final checkpoint (10), "Sampling Only (Cumulative)" achieves the highest Pass Rate (57.9), slightly surpassing "Iterative Learning (Cumulative)" (57.1). Both significantly outperform the baseline.
* **Baseline:** The SFT Baseline remains constant at 29.0 across all checkpoints and k values in both charts.
* **SC@k Trend:** The "Sampling Only (SC@k)" accuracy in the bottom chart improves linearly with k, but the gains are modest (from 30.0 to 35.1 over k=4 to 10).
### Interpretation
The data demonstrates the effectiveness of iterative learning and sampling strategies over a static supervised fine-tuning (SFT) baseline on the MATH benchmark. The key insight is the power of **cumulative evaluation**. While the single-attempt performance (Pass@1) of Iterative Learning improves only marginally, its cumulative performance—likely measuring success across multiple attempts or steps—shows substantial gains. This suggests the model's ability to arrive at correct solutions improves significantly when allowed multiple opportunities or when building upon previous steps.
The "Sampling Only (Cumulative)" method performs comparably to the iterative approach, indicating that repeated sampling without an explicit iterative learning loop can also yield high cumulative success rates. The bottom chart shows that increasing the number of samples (k) for the "Sampling Only" method leads to a predictable, linear increase in accuracy (SC@k), but the absolute improvement per unit of k is relatively small. This implies that while more samples help, the most significant performance leap comes from switching from a single-attempt to a cumulative evaluation framework, as seen in the top chart. The consistent 29.0 baseline provides a clear reference point, highlighting the magnitude of improvement achieved by the other methods.