## Line Graphs: Performance Comparison of Learning Methods
### Overview
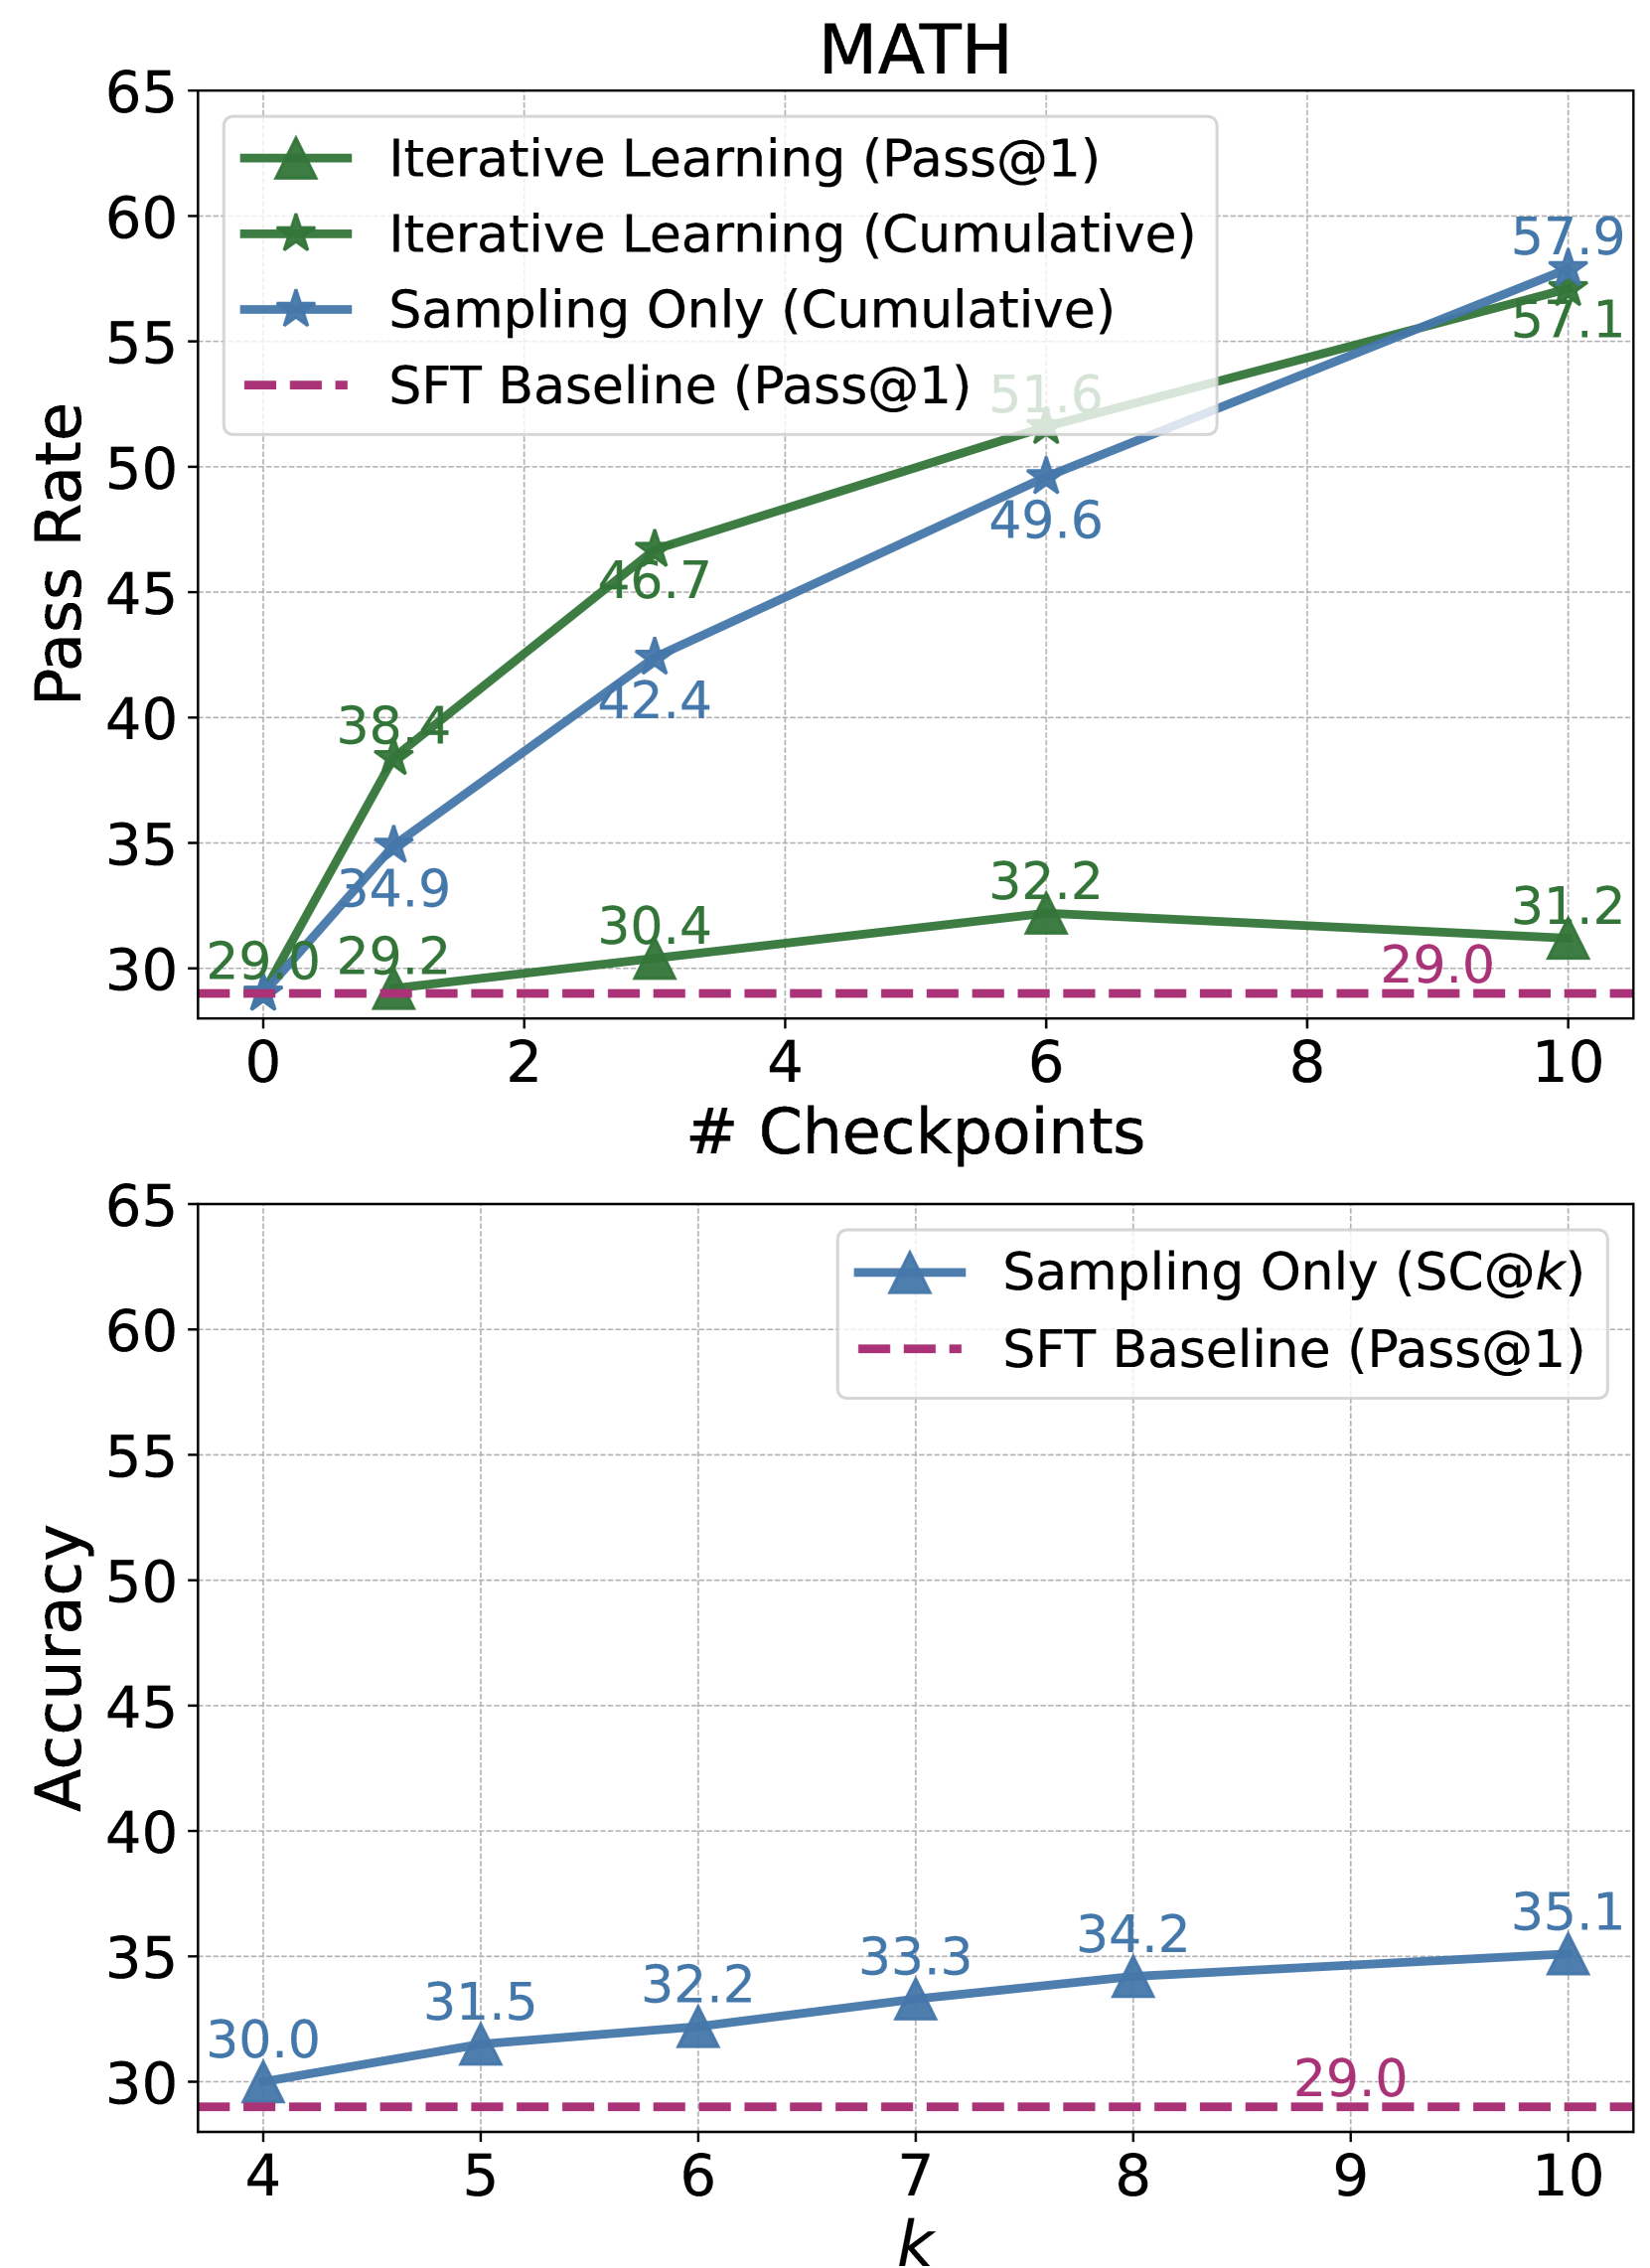
The image contains two line graphs comparing the performance of different learning methods across checkpoints. The top graph measures "Pass Rate" for math tasks, while the bottom graph measures "Accuracy" for sampling-based methods. Both graphs include a static SFT Baseline for comparison.
### Components/Axes
**Top Graph (MATH Performance):**
- **X-axis**: "# Checkpoints" (0 to 10)
- **Y-axis**: "Pass Rate" (29 to 65)
- **Legend**:
- Green line with triangles: Iterative Learning (Pass@1)
- Blue line with stars: Sampling Only (Cumulative)
- Dashed red line: SFT Baseline (Pass@1)
**Bottom Graph (Accuracy):**
- **X-axis**: "k" (4 to 10)
- **Y-axis**: "Accuracy" (29 to 65)
- **Legend**:
- Blue line with triangles: Sampling Only (SC@k)
- Dashed red line: SFT Baseline (Pass@1)
### Detailed Analysis
**Top Graph Trends:**
1. **Iterative Learning (Pass@1)**:
- Starts at 29.0 (checkpoint 0)
- Increases steadily to 57.1 (checkpoint 10)
- Key milestones: 38.4 (checkpoint 2), 46.7 (checkpoint 4), 51.6 (checkpoint 6)
2. **Sampling Only (Cumulative)**:
- Starts at 29.2 (checkpoint 0)
- Outperforms Iterative Learning throughout
- Reaches 57.9 (checkpoint 10)
- Key milestones: 34.9 (checkpoint 2), 42.4 (checkpoint 4), 49.6 (checkpoint 6)
3. **SFT Baseline**:
- Constant at 29.0 across all checkpoints
**Bottom Graph Trends:**
1. **Sampling Only (SC@k)**:
- Starts at 30.0 (k=4)
- Gradual increase to 35.1 (k=10)
- Key milestones: 31.5 (k=5), 32.2 (k=6), 33.3 (k=7), 34.2 (k=8)
2. **SFT Baseline**:
- Constant at 29.0 across all k values
### Key Observations
1. **Performance Gains**:
- Both Iterative Learning and Sampling Only show significant improvement over SFT Baseline
- Sampling Only achieves higher pass rates than Iterative Learning in the top graph
- Sampling Only's accuracy gains are modest but consistent
2. **Convergence**:
- At checkpoint 10, Iterative Learning (57.1) and Sampling Only (57.9) are nearly identical in pass rate
- Sampling Only maintains a slight accuracy advantage (35.1 vs. 29.0)
3. **Diminishing Returns**:
- Top graph shows slowing improvement rates after checkpoint 6
- Bottom graph shows linear but minimal accuracy gains
### Interpretation
The data demonstrates that both Iterative Learning and Sampling Only outperform the static SFT Baseline, with Sampling Only showing marginally better results in pass rate metrics. The cumulative nature of Sampling Only's approach appears more effective for math task performance, though both methods converge at higher checkpoint counts. The accuracy graph suggests Sampling Only's benefits manifest more gradually, with only a 5.1-point improvement across 6 additional checkpoints (k=4 to k=10). This implies that while Sampling Only provides consistent gains, the marginal returns per checkpoint decrease over time. The SFT Baseline's stagnation highlights the value of dynamic learning approaches in this context.