## Chart Type: Behavioral Cloning Performance
### Overview
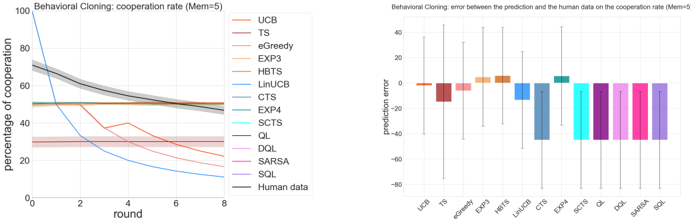
The image presents two charts related to behavioral cloning performance, specifically focusing on cooperation rate. The left chart is a line graph showing the percentage of cooperation over rounds for various algorithms and human data. The right chart is a bar graph displaying the prediction error between the algorithms and human data on the cooperation rate. Both charts are titled "Behavioral Cloning" and specify a memory parameter (Mem=5).
### Components/Axes
**Left Chart (Cooperation Rate):**
* **Title:** Behavioral Cloning: cooperation rate (Mem=5)
* **X-axis:** round (values from 0 to 8, incrementing by 2)
* **Y-axis:** percentage of cooperation (values from 0 to 100, incrementing by 20)
* **Legend (Top-Right):**
* UCB (light-coral)
* TS (brown)
* eGreedy (orange)
* EXP3 (dark-khaki)
* HBTS (dark-goldenrod)
* LinUCB (steelblue)
* CTS (cadetblue)
* EXP4 (medium-turquoise)
* SCTS (cyan)
* QL (purple)
* DQL (orchid)
* SARSA (violet)
* SQL (medium-purple)
* Human data (gray)
**Right Chart (Prediction Error):**
* **Title:** Behavioral Cloning: error between the prediction and the human data on the cooperation rate (Mem=5)
* **X-axis:** Algorithm names (UCB, TS, eGreedy, EXP3, HBTS, LinUCB, CTS, EXP4, SCTS, QL, DQL, SARSA, SQL)
* **Y-axis:** prediction error (values ranging from -80 to 40, incrementing by 20)
* **Colors:** The bars are colored to match the corresponding algorithms in the left chart's legend.
### Detailed Analysis
**Left Chart (Cooperation Rate):**
* **Human data (gray):** Starts at approximately 70% and gradually decreases to around 50% by round 8.
* **LinUCB (steelblue):** Starts at 100% and rapidly decreases to approximately 15% by round 8.
* **CTS (cadetblue):** Starts at approximately 50% and remains relatively stable around that value.
* **UCB (light-coral):** Starts at approximately 30%, dips slightly, then rises to approximately 25% by round 8.
* **TS (brown):** Starts at approximately 30%, dips slightly, then rises to approximately 20% by round 8.
The other algorithms (eGreedy, EXP3, HBTS, EXP4, SCTS, QL, DQL, SARSA, SQL) show relatively low cooperation rates, generally below 10-20% and remain relatively stable.
**Right Chart (Prediction Error):**
* **UCB (light-coral):** Prediction error is approximately 0.
* **TS (brown):** Prediction error is approximately -15.
* **eGreedy (orange):** Prediction error is approximately -5.
* **EXP3 (dark-khaki):** Prediction error is approximately 5.
* **HBTS (dark-goldenrod):** Prediction error is approximately 5.
* **LinUCB (steelblue):** Prediction error is approximately -10.
* **CTS (cadetblue):** Prediction error is approximately -30.
* **EXP4 (medium-turquoise):** Prediction error is approximately -1.
* **SCTS (cyan):** Prediction error is approximately -30.
* **QL (purple):** Prediction error is approximately -30.
* **DQL (orchid):** Prediction error is approximately -30.
* **SARSA (violet):** Prediction error is approximately -30.
* **SQL (medium-purple):** Prediction error is approximately -30.
The error bars indicate the variability in the prediction error for each algorithm.
### Key Observations
* LinUCB has a high initial cooperation rate that drops sharply over rounds.
* CTS maintains a relatively stable cooperation rate.
* The human data shows a gradual decrease in cooperation rate over rounds.
* CTS, SCTS, QL, DQL, SARSA, and SQL have the largest negative prediction errors.
* EXP3 and HBTS have small positive prediction errors.
### Interpretation
The charts compare the performance of various algorithms in mimicking human cooperation behavior through behavioral cloning. The cooperation rate chart shows how the algorithms' cooperation levels change over time, while the prediction error chart quantifies how well each algorithm's predictions match the actual human data.
The large negative prediction errors for CTS, SCTS, QL, DQL, SARSA, and SQL suggest that these algorithms consistently underestimate the human cooperation rate. Conversely, the small positive prediction errors for EXP3 and HBTS indicate a slight overestimation. LinUCB's rapid decline in cooperation rate suggests it may be overfitting to the initial conditions or failing to adapt effectively over time. The human data provides a baseline for comparison, showing a gradual decrease in cooperation, which the algorithms attempt to replicate with varying degrees of success.