\n
## Grouped Bar Chart: Accuracy Comparison of Methods
### Overview
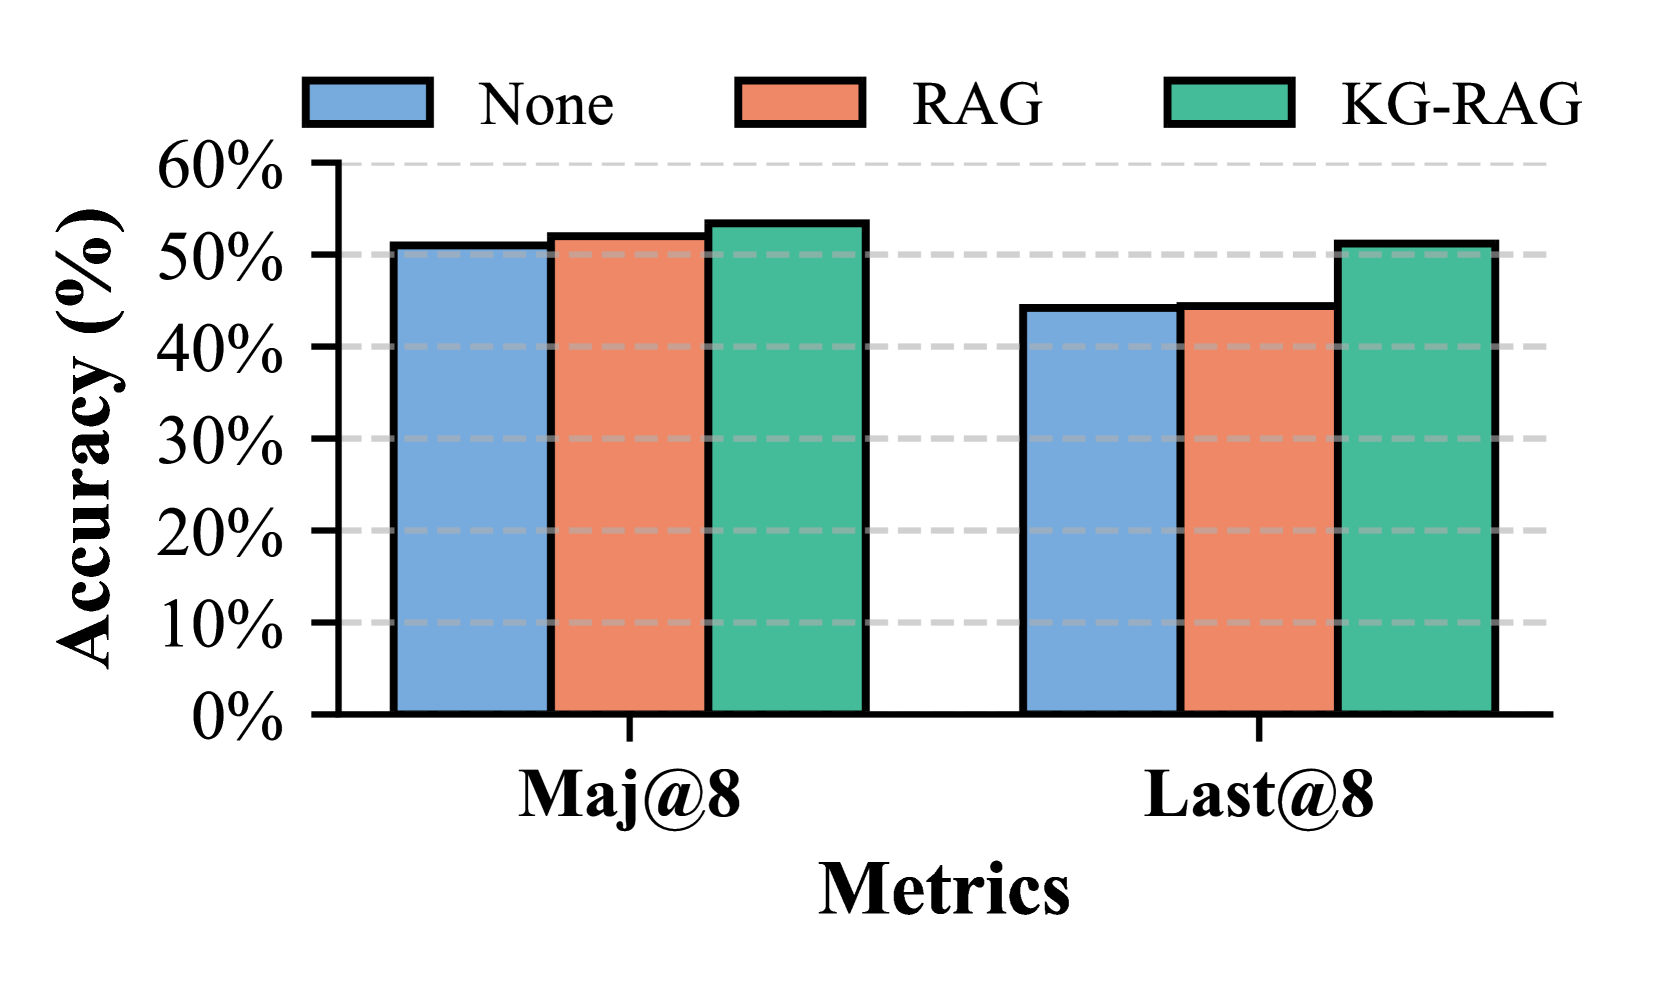
This is a grouped bar chart comparing the accuracy performance of three different methods ("None", "RAG", "KG-RAG") across two evaluation metrics ("Maj@8" and "Last@8"). The chart displays accuracy as a percentage.
### Components/Axes
* **Chart Type:** Grouped Bar Chart.
* **Y-Axis:** Labeled "Accuracy (%)". The scale runs from 0% to 60% in increments of 10%. Horizontal grid lines are present at each 10% increment.
* **X-Axis:** Labeled "Metrics". It contains two categorical groups:
1. **Maj@8**
2. **Last@8**
* **Legend:** Positioned at the top center of the chart. It defines three data series by color:
* **Blue Box:** "None"
* **Orange Box:** "RAG"
* **Green Box:** "KG-RAG"
### Detailed Analysis
**Data Series and Approximate Values:**
The chart presents two clusters of bars, one for each metric. Each cluster contains three bars corresponding to the methods in the legend.
**1. Metric: Maj@8 (Left Cluster)**
* **Trend:** All three methods show relatively high and similar accuracy, with a slight upward trend from "None" to "KG-RAG".
* **Data Points (Approximate):**
* **None (Blue):** ~51%
* **RAG (Orange):** ~52%
* **KG-RAG (Green):** ~54%
**2. Metric: Last@8 (Right Cluster)**
* **Trend:** Accuracy is generally lower than for Maj@8. "None" and "RAG" show nearly identical performance, while "KG-RAG" shows a significant improvement over them.
* **Data Points (Approximate):**
* **None (Blue):** ~45%
* **RAG (Orange):** ~45%
* **KG-RAG (Green):** ~52%
### Key Observations
1. **KG-RAG Superiority:** The "KG-RAG" method achieves the highest accuracy in both metrics.
2. **Metric Sensitivity:** The performance gap between methods is more pronounced for the "Last@8" metric than for "Maj@8".
3. **RAG vs. None:** The standard "RAG" method provides only a marginal improvement over "None" for "Maj@8" and no discernible improvement for "Last@8".
4. **Overall Performance Drop:** All methods show lower accuracy scores on the "Last@8" metric compared to the "Maj@8" metric.
### Interpretation
The data suggests that the **KG-RAG** method is the most effective of the three evaluated approaches for the tasks measured by these metrics. Its consistent lead indicates that integrating a knowledge graph (KG) with retrieval-augmented generation (RAG) provides a robust advantage.
The minimal difference between "None" (likely a baseline model) and "RAG" implies that standard retrieval augmentation alone may not be sufficient to improve performance on these specific benchmarks, particularly for the "Last@8" metric. This could indicate that the challenges in "Last@8" are not solved by simple retrieval but benefit from the structured knowledge or reasoning pathways that a KG-RAG system might provide.
The universal drop in accuracy from "Maj@8" to "Last@8" suggests that the "Last@8" metric represents a more difficult task or evaluation criterion. "KG-RAG's" ability to maintain a relatively high score (~52%) on this harder metric, while the other methods fall to ~45%, highlights its particular strength in handling the conditions that make "Last@8" challenging.