## Diagram: Acoustic Signal Decomposition and Environmental Analysis
### Overview
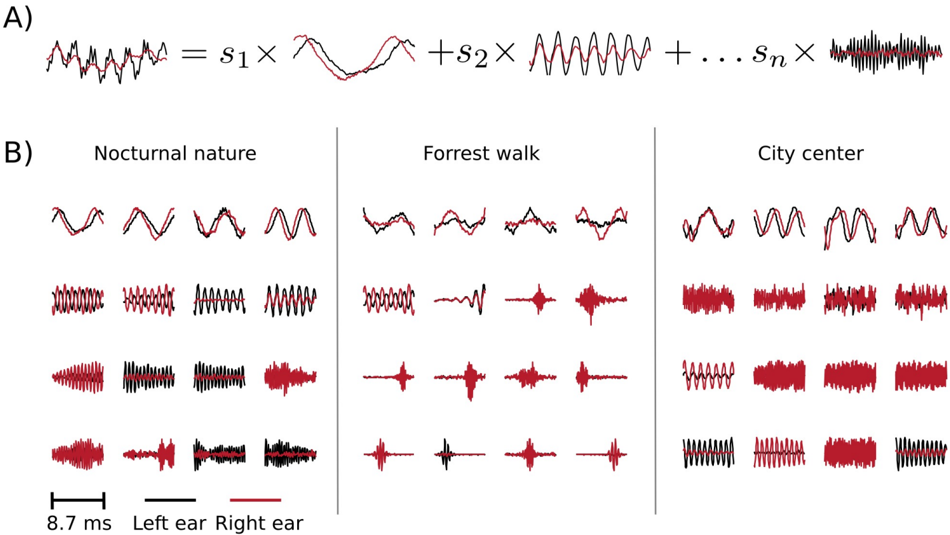
The image presents two primary components:
1. **Section A**: A mathematical decomposition of a complex waveform into a sum of weighted sine waves (`s₁×waveform₁ + s₂×waveform₂ + ... + sₙ×waveformₙ`).
2. **Section B**: Three environmental scenarios (Nocturnal nature, Forrest walk, City center) analyzed through waveform and spectrogram visualizations, with subplots comparing left/right ear signals and spectrograms over time.
---
### Components/Axes
#### Section A
- **Equation**:
`Complex Waveform = s₁×Waveform₁ + s₂×Waveform₂ + ... + sₙ×Waveformₙ`
- `s₁, s₂, ..., sₙ`: Scaling factors for individual sine wave components.
- `Waveform₁, Waveform₂, ..., Waveformₙ`: Three distinct waveform types (complex, sinusoidal, chaotic).
#### Section B
- **Columns**:
- **Nocturnal nature** (leftmost), **Forrest walk** (middle), **City center** (rightmost).
- **Rows**:
1. **Combined waveform** (black + red lines).
2. **Left ear (black) vs. Right ear (red) waveforms**.
3. **Spectrograms** (black + red intensity).
4. **Spectrograms with time axis** (8.7 ms duration).
- **Legend**:
- **Black**: Left ear signal.
- **Red**: Right ear signal.
- Positioned at the bottom of the image.
---
### Detailed Analysis
#### Section A
- **Waveform Decomposition**:
- The complex waveform is broken into three components:
1. **Waveform₁**: Irregular, high-frequency oscillations (black line).
2. **Waveform₂**: Smooth sinusoidal pattern (red line).
3. **Waveform₃**: Chaotic, low-amplitude fluctuations (black line).
- Scaling factors (`s₁, s₂, s₃`) modulate the contribution of each component.
#### Section B
- **Nocturnal Nature**:
- **Waveforms**: Irregular amplitude modulations (first row).
- **Left/Right Ear Signals**: Asymmetric phase differences (second row).
- **Spectrograms**: Broad frequency distribution with intermittent high-energy peaks (third row).
- **Time-Axis Spectrogram**: 8.7 ms duration with sparse red intensity (fourth row).
- **Forrest Walk**:
- **Waveforms**: Smoother, periodic oscillations (first row).
- **Left/Right Ear Signals**: Minimal phase differences (second row).
- **Spectrograms**: Dominant low-frequency bands with transient spikes (third row).
- **Time-Axis Spectrogram**: 8.7 ms duration with localized red intensity.
- **City Center**:
- **Waveforms**: High-frequency, consistent oscillations (first row).
- **Left/Right Ear Signals**: Strong phase alignment (second row).
- **Spectrograms**: Dense red intensity across mid-to-high frequencies (third row).
- **Time-Axis Spectrogram**: 8.7 ms duration with uniform red distribution.
---
### Key Observations
1. **Waveform Complexity**:
- Nocturnal nature exhibits the most variability, while City center shows the most consistent high-frequency content.
2. **Binaural Differences**:
- Left/right ear signals diverge most in Nocturnal nature, suggesting spatial sound localization challenges.
3. **Spectrogram Trends**:
- City center spectrograms show broader frequency coverage, while Forrest walk spectrograms highlight transient events.
4. **Time Consistency**:
- All spectrograms share an 8.7 ms time axis, indicating standardized recording durations.
---
### Interpretation
- **Environmental Acoustic Signatures**:
- The decomposition in Section A demonstrates how complex sounds (e.g., environmental noise) are constructed from simpler sine wave components.
- Section B reveals that urban environments (City center) produce more structured, high-frequency noise, while natural settings (Forrest walk) emphasize low-frequency, transient sounds.
- **Binaural Processing**:
- Phase differences between left/right ear signals (Section B, second row) suggest that spatial sound localization varies by environment. Nocturnal nature’s asymmetry may reflect irregular sound sources (e.g., animals), whereas City center’s alignment indicates predictable, directional noise (e.g., traffic).
- **Spectrogram Insights**:
- The City center’s dense spectrograms imply a richer frequency palette, likely due to human activity and infrastructure. Forrest walk spectrograms’ transient spikes may correspond to animal vocalizations or footsteps.
---
### Limitations
- **Missing Scales**: Amplitude, frequency, and time axes lack explicit numerical ranges, limiting quantitative analysis.
- **Waveform Definitions**: Section A’s `Waveform₁`, `Waveform₂`, and `Waveform₃` are described qualitatively (e.g., "chaotic") without mathematical formulas.
- **Environmental Context**: No metadata on recording conditions (e.g., time of day, location specifics) is provided.
This analysis underscores the interplay between acoustic decomposition and environmental acoustics, highlighting how signal processing techniques can differentiate natural and urban soundscapes.