## Line Chart: AI Model Benchmark Performance Comparison
### Overview
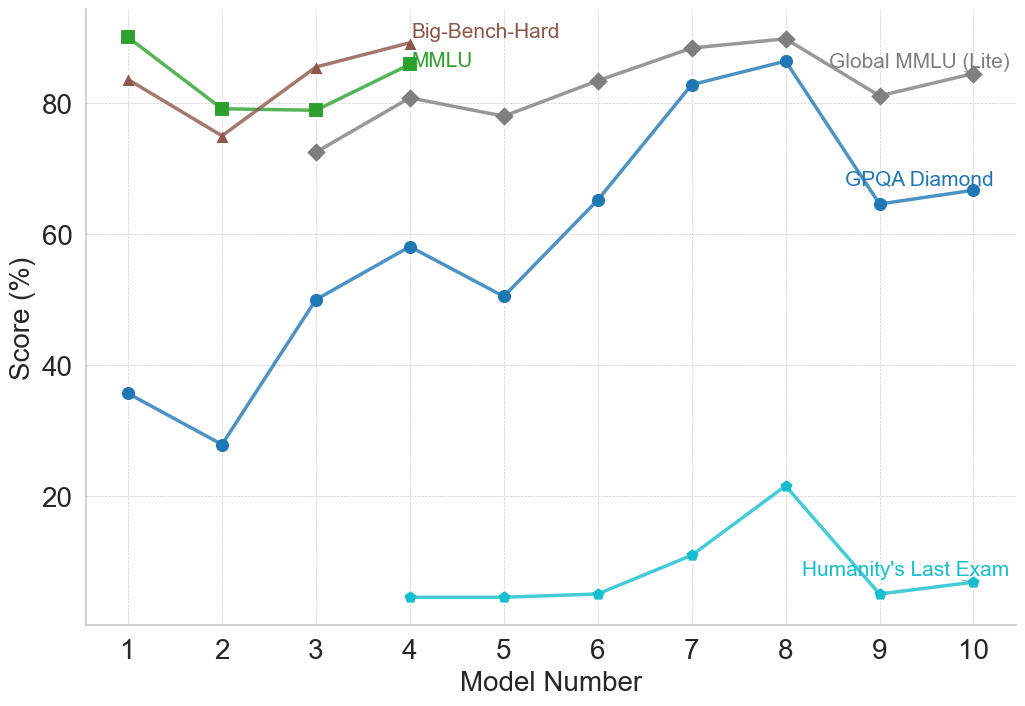
The image is a line chart comparing the performance scores (in percentage) of ten different AI models across five distinct benchmarks. The chart visualizes how model capabilities vary across different evaluation tasks, showing trends of improvement, decline, or stability as model numbers increase.
### Components/Axes
- **X-Axis**: Labeled "Model Number", with discrete integer markers from 1 to 10.
- **Y-Axis**: Labeled "Score (%)", with a linear scale from 0 to 80, marked at intervals of 20 (0, 20, 40, 60, 80). Horizontal grid lines extend from these marks.
- **Data Series & Legend**: The legend is integrated into the chart area, with labels placed near the end of their respective lines.
1. **Big-Bench-Hard**: Brown line with upward-pointing triangle markers (▲).
2. **MMLU**: Green line with square markers (■).
3. **Global MMLU (Lite)**: Gray line with diamond markers (◆).
4. **GPQA Diamond**: Blue line with circle markers (●).
5. **Humanity's Last Exam**: Cyan (light blue) line with circle markers (●).
### Detailed Analysis
**Data Series Trends and Approximate Values:**
1. **Big-Bench-Hard (Brown, ▲)**
* **Trend**: Starts high, dips at Model 2, then shows a general upward trend with a peak at Model 4, followed by a gradual decline.
* **Approximate Values**: Model 1: ~83%, Model 2: ~75%, Model 3: ~85%, Model 4: ~88%, Model 5: ~78%, Model 6: ~83%, Model 7: ~88%, Model 8: ~89%, Model 9: ~81%, Model 10: ~84%.
2. **MMLU (Green, ■)**
* **Trend**: Starts very high, drops sharply at Model 2, then plateaus before rising again at Model 4. Data is not plotted for Models 5-10.
* **Approximate Values**: Model 1: ~88%, Model 2: ~79%, Model 3: ~79%, Model 4: ~85%.
3. **Global MMLU (Lite) (Gray, ◆)**
* **Trend**: Begins at Model 3. Shows a general upward trend with minor fluctuations, peaking at Model 8, followed by a dip and partial recovery.
* **Approximate Values**: Model 3: ~72%, Model 4: ~80%, Model 5: ~78%, Model 6: ~83%, Model 7: ~88%, Model 8: ~89%, Model 9: ~81%, Model 10: ~84%.
4. **GPQA Diamond (Blue, ●)**
* **Trend**: Highly volatile. Starts low, dips at Model 2, then rises sharply to a local peak at Model 4. After a dip at Model 5, it climbs steeply to its highest point at Model 8, followed by a significant drop at Model 9 and a slight recovery.
* **Approximate Values**: Model 1: ~36%, Model 2: ~28%, Model 3: ~50%, Model 4: ~58%, Model 5: ~50%, Model 6: ~65%, Model 7: ~82%, Model 8: ~86%, Model 9: ~64%, Model 10: ~66%.
5. **Humanity's Last Exam (Cyan, ●)**
* **Trend**: Begins at Model 4 with very low scores. Remains flat and low until Model 6, then rises to a distinct peak at Model 8 before dropping sharply and recovering slightly.
* **Approximate Values**: Model 4: ~5%, Model 5: ~5%, Model 6: ~6%, Model 7: ~11%, Model 8: ~21%, Model 9: ~5%, Model 10: ~7%.
### Key Observations
1. **Benchmark Difficulty Hierarchy**: There is a clear stratification in scores. "Big-Bench-Hard," "MMLU," and "Global MMLU (Lite)" consistently yield scores in the 70-90% range. "GPQA Diamond" shows a wide range (28-86%), while "Humanity's Last Exam" scores are an order of magnitude lower (5-21%), suggesting it is a significantly more difficult benchmark.
2. **Model 8 Peak**: Model 8 achieves the highest or near-highest score on four of the five benchmarks (Big-Bench-Hard, Global MMLU (Lite), GPQA Diamond, and Humanity's Last Exam), indicating it may be the most capable model overall in this set.
3. **Performance Drop at Model 9**: A notable decline occurs for GPQA Diamond and Humanity's Last Exam at Model 9, while the MMLU-family benchmarks show a less severe dip. This could indicate a model specialization or a regression on specific types of tasks.
4. **Missing Data**: The MMLU (green) series is only plotted for Models 1-4, which may imply the benchmark was not run or reported for later models.
### Interpretation
This chart illustrates the non-uniform progress of AI model development. Performance gains are benchmark-dependent. While models show steady improvement on knowledge-intensive tasks like MMLU (Massive Multitask Language Understanding), progress on more specialized or reasoning-heavy benchmarks like GPQA Diamond is more erratic. The extremely low scores on "Humanity's Last Exam" suggest it represents a frontier challenge that current models (up to Model 10) have not come close to solving, highlighting a significant gap between model capabilities and this particular evaluation's demands. The peak at Model 8 followed by a drop at Model 9 could reflect different model architectures or training focuses, where optimization for certain benchmarks may come at the cost of others. The data underscores that "model number" is a proxy for iteration, not a guarantee of uniform improvement across all cognitive domains.