## Line Chart: EGA vs. Environment Step
### Overview
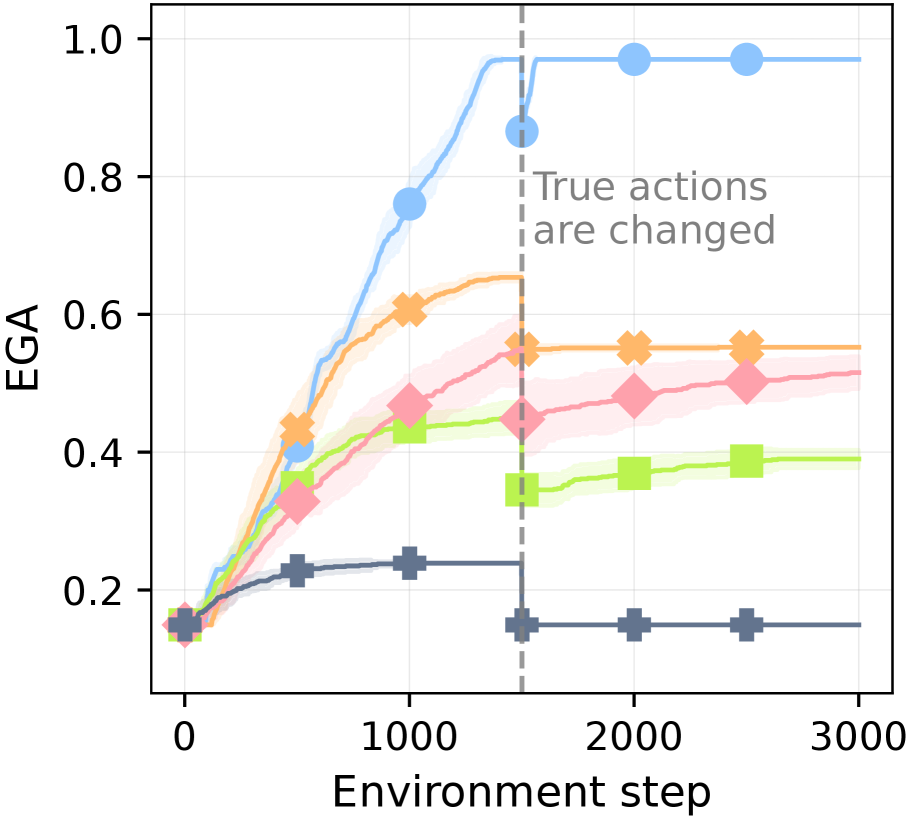
The image is a line chart plotting the performance metric "EGA" against "Environment step" for five distinct algorithms or conditions. The chart shows learning curves that generally increase and then plateau, with a significant event marked by a vertical dashed line where the "True actions are changed." The data includes shaded regions around each line, likely representing confidence intervals or standard deviation.
### Components/Axes
* **X-Axis:** Labeled "Environment step". The scale runs from 0 to 3000, with major tick marks at 0, 1000, 2000, and 3000.
* **Y-Axis:** Labeled "EGA". The scale runs from 0.0 to 1.0, with major tick marks at 0.0, 0.2, 0.4, 0.6, 0.8, and 1.0.
* **Legend:** There is no explicit legend box. The five data series are distinguished by color and marker shape:
1. **Light Blue Line with Circle Markers (●)**
2. **Orange Line with 'X' Markers (✖)**
3. **Pink/Red Line with Diamond Markers (◆)**
4. **Light Green Line with Square Markers (■)**
5. **Dark Gray/Blue Line with Plus Markers (✚)**
* **Annotation:** A vertical, gray, dashed line is positioned at approximately Environment step = 1500. Text to the right of this line reads: "True actions are changed".
### Detailed Analysis
**Data Series Trends and Approximate Values:**
1. **Light Blue (●):**
* **Trend:** Shows the steepest and highest learning curve. It rises rapidly from step 0, approaches a plateau near EGA=1.0 before step 1500, and remains stable at that high level after the action change.
* **Key Points:** Starts ~0.15 at step 0. Reaches ~0.75 at step 1000. At the action change (step ~1500), it is at ~0.85. Post-change, it stabilizes at ~0.98.
2. **Orange (✖):**
* **Trend:** Rises steadily, plateaus around step 1000, and shows a slight dip immediately after the action change before recovering to a stable level.
* **Key Points:** Starts ~0.15. Reaches ~0.6 at step 1000. At the action change, it is ~0.55. Post-change, it stabilizes at ~0.55.
3. **Pink/Red (◆):**
* **Trend:** Shows a moderate, steady increase throughout, with a very slight dip or flattening after the action change before continuing a slow rise.
* **Key Points:** Starts ~0.15. Reaches ~0.45 at step 1000. At the action change, it is ~0.45. Post-change, it rises slowly to ~0.5 by step 3000.
4. **Light Green (■):**
* **Trend:** Increases to a moderate level, then experiences a noticeable drop immediately after the action change, followed by a partial recovery and stabilization.
* **Key Points:** Starts ~0.15. Reaches ~0.42 at step 1000. At the action change, it is ~0.45. Immediately after, it drops to ~0.35, then recovers to stabilize at ~0.39.
5. **Dark Gray/Blue (✚):**
* **Trend:** Shows the lowest performance. It rises slightly initially, plateaus early, and then drops sharply at the action change, remaining flat at a low level afterward.
* **Key Points:** Starts ~0.15. Reaches ~0.23 at step 1000. At the action change, it is ~0.23. Immediately after, it drops to ~0.15 and remains constant.
### Key Observations
1. **Performance Hierarchy:** A clear and consistent performance ranking is established by step 1000 and maintained throughout: Light Blue > Orange > Pink/Red > Light Green > Dark Gray.
2. **Impact of Action Change:** The event at step 1500 ("True actions are changed") has a varying impact:
* **Highly Robust:** The top-performing Light Blue series is largely unaffected.
* **Moderately Affected:** The Orange and Pink/Red series show minor, temporary disruptions.
* **Significantly Affected:** The Light Green and Dark Gray series experience a clear performance drop, with the Dark Gray series losing all its prior gains.
3. **Stability Post-Change:** After the initial reaction to the action change, all series stabilize at new or previous levels, indicating adaptation or convergence to a new policy.
4. **Initial Conditions:** All series begin at approximately the same EGA value (~0.15) at step 0.
### Interpretation
This chart likely compares the robustness and adaptability of different reinforcement learning algorithms or agent policies when faced with a non-stationary environment (where the mapping from states to "true actions" changes).
* **The Light Blue algorithm** demonstrates superior learning capability and exceptional robustness. It not only achieves near-perfect performance (EGA≈1.0) but also maintains it seamlessly despite the environmental change, suggesting it has learned a highly generalizable or stable policy.
* **The Orange and Pink/Red algorithms** show good learning but are less robust. They adapt to the change but settle at a lower performance level than the top performer, indicating some dependency on the original action mapping.
* **The Light Green and Dark Gray algorithms** are the most sensitive to environmental change. The sharp drop, especially for Dark Gray, suggests these policies were overfitted to the initial action mapping and lack the flexibility to adapt. The Dark Gray series' return to its starting value implies a complete failure to retain useful knowledge after the change.
* **Overall,** the data suggests a strong correlation between an algorithm's peak performance and its robustness to this specific type of environmental perturbation. The experiment highlights the importance of testing agent performance under changing conditions, not just in a static environment. The shaded confidence intervals are relatively narrow, indicating consistent performance across multiple runs for each condition.