## Diagram: Knowledge Graph and Large Language Model Synergies
### Overview
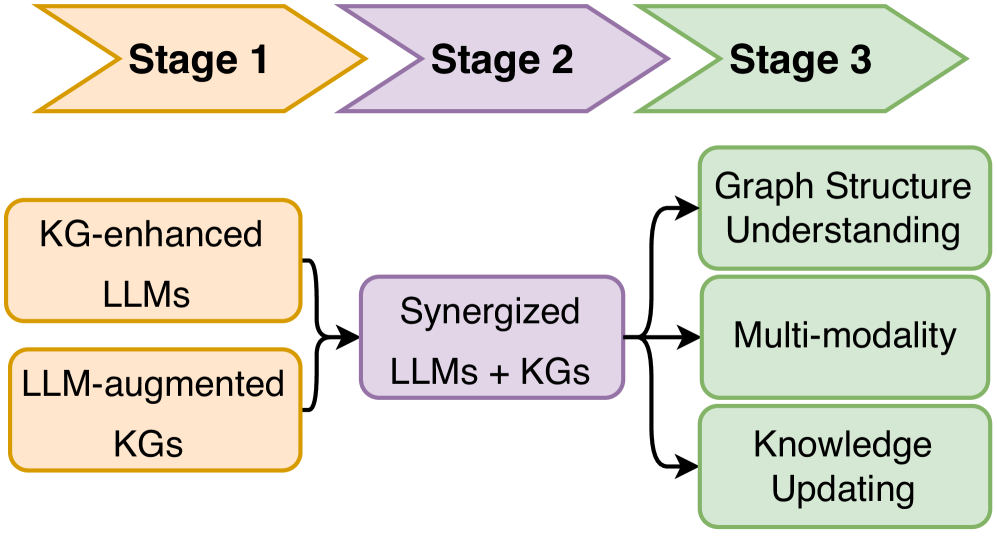
The image presents a diagram illustrating a three-stage process involving Knowledge Graphs (KGs) and Large Language Models (LLMs). The diagram outlines how KGs and LLMs are enhanced and synergized to achieve specific outcomes.
### Components/Axes
* **Stages:** The diagram is divided into three stages, represented by right-pointing arrows.
* **Stage 1:** Labeled "Stage 1" with a gold/orange arrow.
* **Stage 2:** Labeled "Stage 2" with a purple arrow.
* **Stage 3:** Labeled "Stage 3" with a green arrow.
* **Input (Stage 1):** Two rounded rectangles on the left represent the inputs to the process.
* **Top Input:** Labeled "KG-enhanced LLMs" with a gold/orange border.
* **Bottom Input:** Labeled "LLM-augmented KGs" with a gold/orange border.
* **Synergy (Stage 2):** A rounded rectangle in the center represents the synergy stage.
* **Center Node:** Labeled "Synergized LLMs + KGs" with a purple border.
* **Outputs (Stage 3):** Three rounded rectangles on the right represent the outputs of the process.
* **Top Output:** Labeled "Graph Structure Understanding" with a green border.
* **Middle Output:** Labeled "Multi-modality" with a green border.
* **Bottom Output:** Labeled "Knowledge Updating" with a green border.
* **Flow:** Arrows indicate the flow of information from the inputs to the synergy stage and then to the outputs.
### Detailed Analysis
* **Stage 1:**
* "KG-enhanced LLMs" represents Large Language Models that have been improved or augmented using Knowledge Graphs.
* "LLM-augmented KGs" represents Knowledge Graphs that have been improved or augmented using Large Language Models.
* **Stage 2:**
* "Synergized LLMs + KGs" represents the combination and integration of KG-enhanced LLMs and LLM-augmented KGs.
* **Stage 3:**
* "Graph Structure Understanding" represents the ability to understand and reason about the structure of graphs.
* "Multi-modality" represents the ability to process and integrate information from multiple modalities (e.g., text, images, audio).
* "Knowledge Updating" represents the ability to update and maintain knowledge over time.
### Key Observations
* The diagram illustrates a sequential process where KGs and LLMs are initially enhanced separately, then synergized, and finally used to achieve specific outcomes.
* The color-coding of the stages (orange, purple, green) provides a visual cue for understanding the flow of information.
* The diagram highlights the importance of both KG-enhanced LLMs and LLM-augmented KGs in achieving the desired outcomes.
### Interpretation
The diagram suggests a strategic approach to leveraging the strengths of both Knowledge Graphs and Large Language Models. By first enhancing each technology separately and then synergizing them, the process aims to achieve a more comprehensive and effective understanding of data, leading to improved graph structure understanding, multi-modality processing, and knowledge updating. The diagram emphasizes the reciprocal relationship between KGs and LLMs, where each technology can enhance the other, leading to a more powerful combined system.