# Technical Data Extraction: Neural Network Layer Accuracy Analysis
## 1. Document Overview
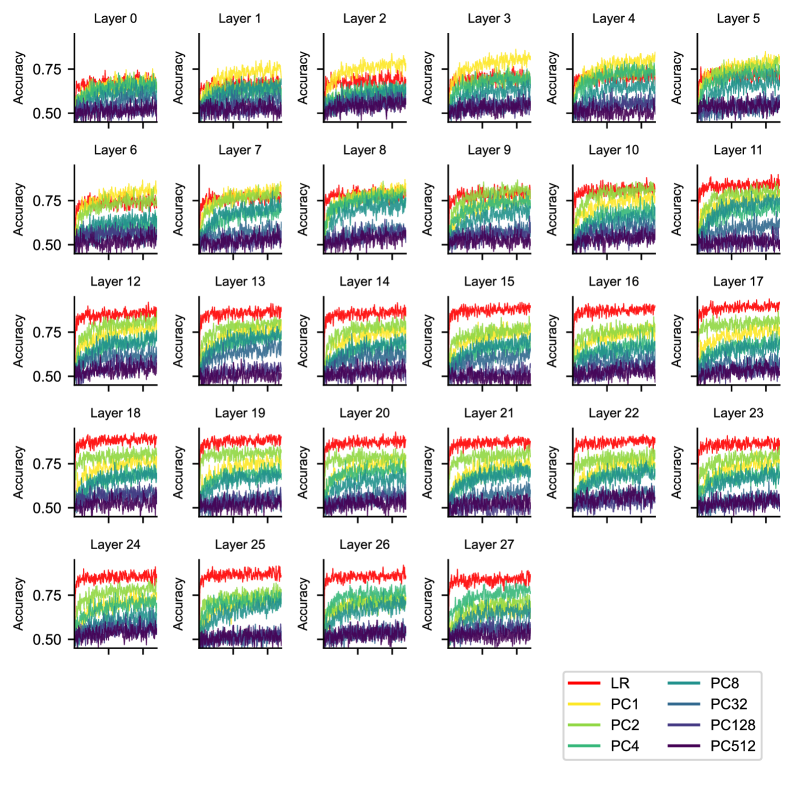
This image contains a grid of 28 line charts, organized in 5 rows. Each chart represents a specific "Layer" of a neural network (from Layer 0 to Layer 27). The charts track the "Accuracy" of different models or principal component configurations over time/training steps.
## 2. Global Chart Metadata
* **Type:** Multi-panel line chart (Small Multiples).
* **Y-Axis Label:** "Accuracy" (present on every individual subplot).
* **Y-Axis Scale:** Ranges from approximately 0.45 to 0.90, with explicit markers at **0.50** and **0.75**.
* **X-Axis:** Unlabeled numerical steps (likely training epochs or iterations).
* **Legend Location:** Bottom right corner of the image.
## 3. Legend and Data Series Identification
The legend defines 8 distinct data series based on color. The colors follow a spectral gradient from red to dark purple.
| Label | Color | Visual Trend Description |
| :--- | :--- | :--- |
| **LR** | Red | Starts high or rises rapidly; becomes the top-performing series in later layers. |
| **PC1** | Yellow | High initial performance in early layers; performance plateaus or is overtaken in later layers. |
| **PC2** | Light Green | Mid-high performance; generally follows the trend of PC1 but slightly lower. |
| **PC4** | Medium Green | Mid-range performance; shows steady improvement across layers. |
| **PC8** | Teal | Mid-low performance; shows moderate upward slope. |
| **PC32** | Blue-Grey | Low performance; remains relatively flat near the 0.50 - 0.60 range. |
| **PC128** | Dark Blue | Very low performance; fluctuates near the 0.50 baseline. |
| **PC512** | Dark Purple | Lowest performance; consistently at or below the 0.50 baseline. |
---
## 4. Component Analysis by Layer Groups
### Region 1: Early Layers (Layer 0 - Layer 5)
* **Layer 0:** All series are clustered tightly between 0.50 and 0.70. No single series dominates significantly.
* **Layer 1 - 3:** The **Yellow (PC1)** line is the clear leader, reaching near 0.80 accuracy. The **Red (LR)** line is positioned in the middle of the pack.
* **Trend:** Accuracy for higher PC counts (PC1, PC2) is initially superior to the baseline LR.
### Region 2: Middle Layers (Layer 6 - Layer 11)
* **Layer 6 - 8:** A transition occurs. The **Red (LR)** line begins to climb, matching the **Yellow (PC1)** line.
* **Layer 9 - 11:** The **Red (LR)** line clearly overtakes all other series, establishing itself as the top performer with accuracy exceeding 0.80.
* **Trend:** The "PC" series (Yellow/Green) begin to plateau or slightly decline in relative rank, while LR continues to improve.
### Region 3: Deep Layers (Layer 12 - Layer 23)
* **Consistency:** The hierarchy becomes very stable.
* **Top Tier:** **Red (LR)** is consistently the highest, maintaining accuracy between 0.85 and 0.90.
* **Middle Tier:** **Yellow (PC1)**, **Light Green (PC2)**, and **Medium Green (PC4)** follow in descending order, spread between 0.65 and 0.80.
* **Bottom Tier:** **PC32, PC128, and PC512** (Blue/Purple) remain stagnant near the 0.50 accuracy mark, showing little to no improvement regardless of the layer depth.
### Region 4: Final Layers (Layer 24 - Layer 27)
* **Layer 27:** The final state shows a clear separation.
* **LR (Red):** ~0.88 Accuracy.
* **PC4 (Medium Green):** ~0.78 Accuracy.
* **PC1 (Yellow):** Has dropped significantly relative to its early performance, now sitting below PC4 at ~0.70.
* **PC512 (Purple):** ~0.50 Accuracy.
---
## 5. Key Observations and Trends
1. **The "LR" Dominance:** While the Logistic Regression (LR) starts as a mediocre performer in Layer 0, it consistently improves as layers deepen, eventually becoming the most accurate method by a significant margin.
2. **PC Performance Inversion:** In early layers (0-3), low-dimensional PC components (PC1, PC2) perform best. However, in deeper layers, their relative accuracy drops compared to the LR baseline.
3. **Dimensionality Inverse Correlation:** There is a clear inverse relationship between the PC number and accuracy. **PC1** (Yellow) is consistently higher than **PC512** (Purple). As the PC number increases (representing more components/higher dimensionality), the accuracy consistently decreases toward the 0.50 (chance) baseline.
4. **Stability:** Beyond Layer 15, the relative ordering of the techniques and their absolute accuracy values remain largely unchanged, suggesting a saturation point in feature representation for these models.