## Line Chart: Sokoban Gridworld: Adjusted Trap Rate
### Overview
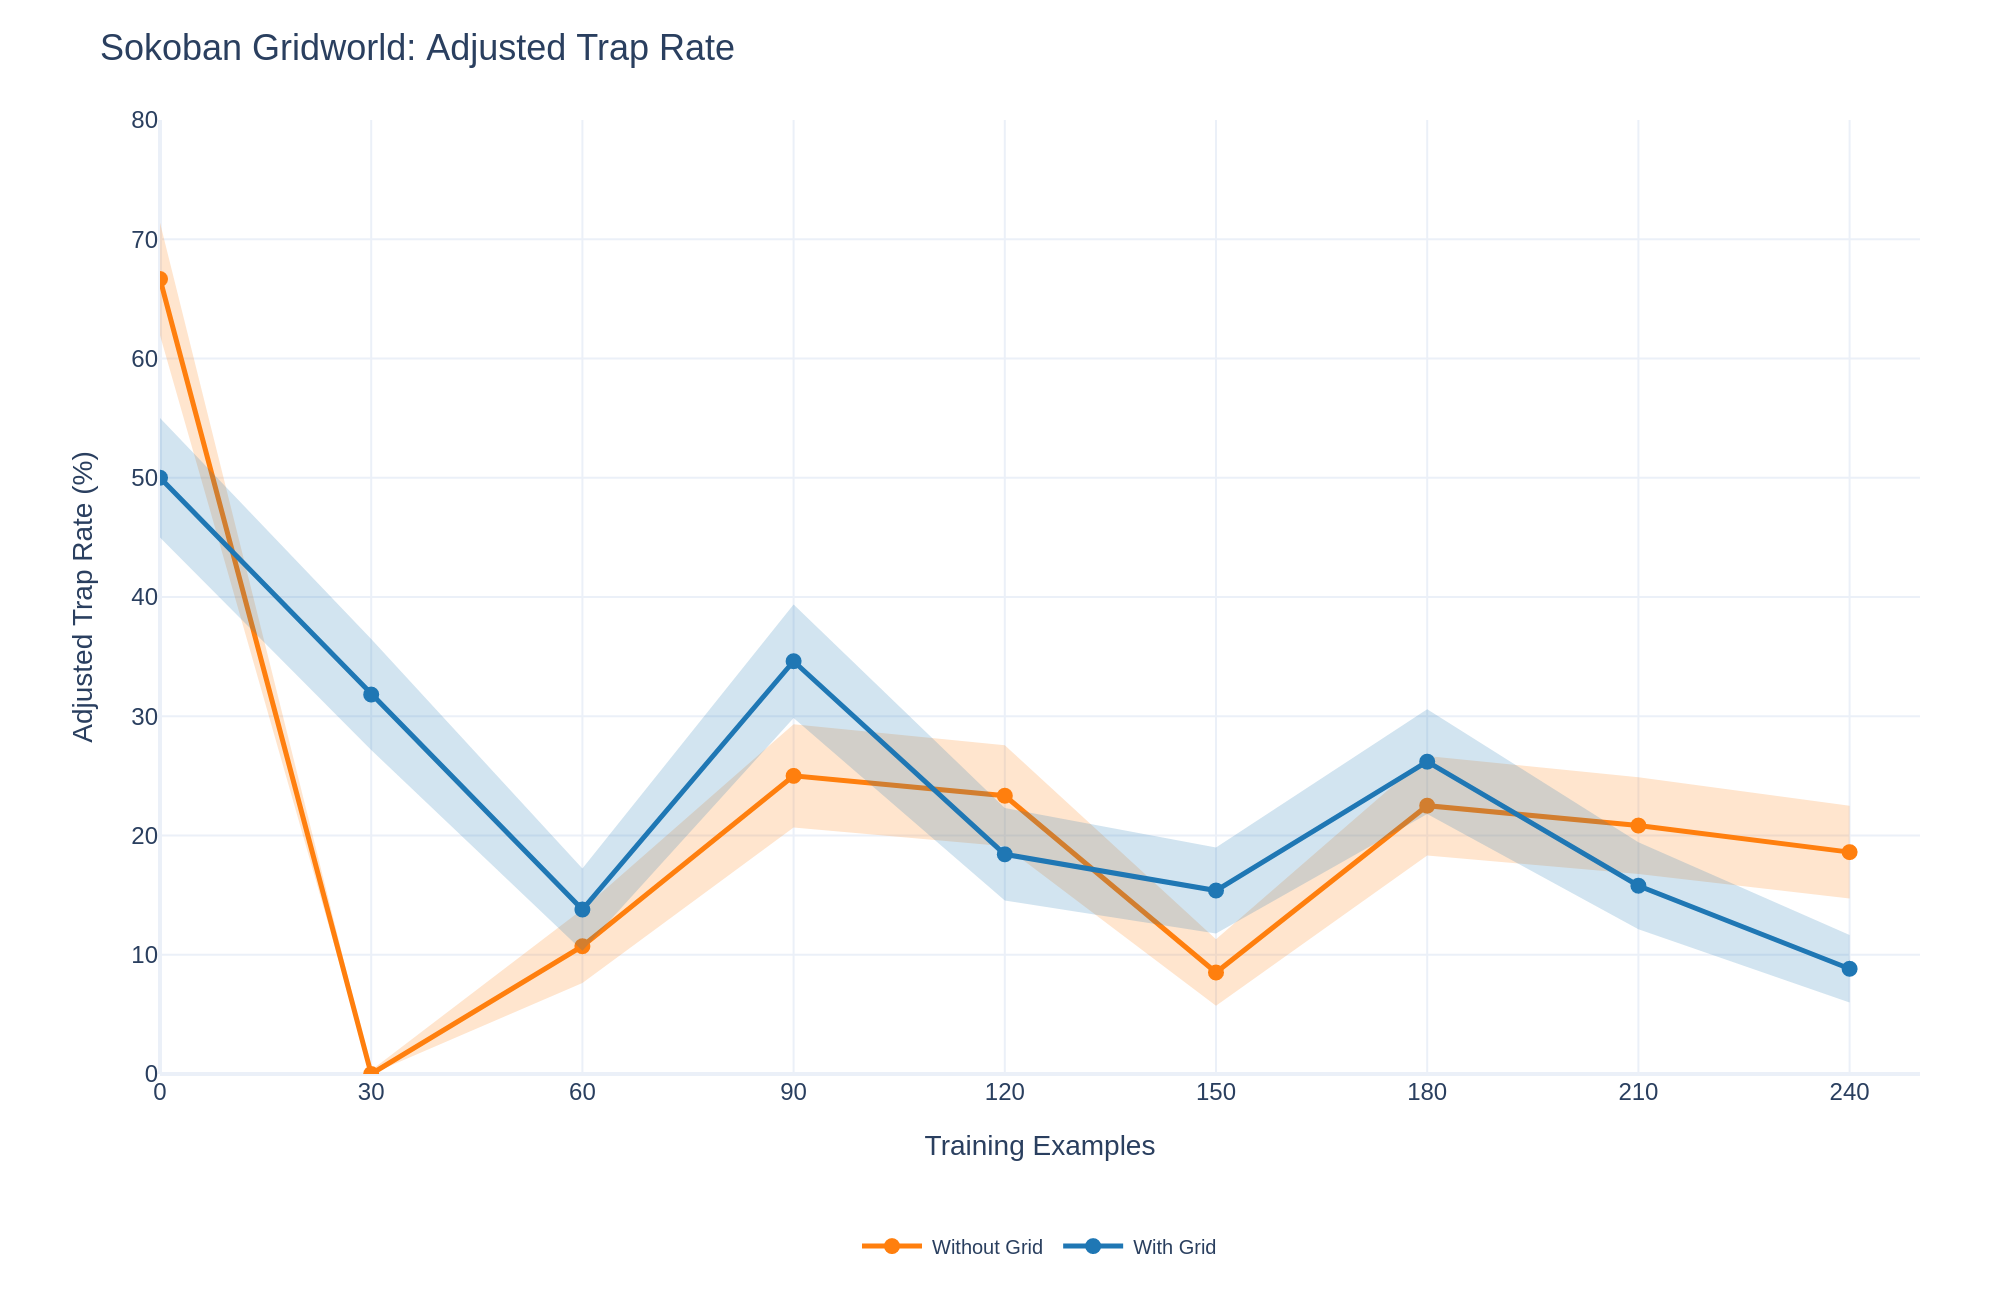
The image is a line chart comparing the adjusted trap rate (%) in a Sokoban Gridworld environment with and without a grid, as a function of the number of training examples. The chart displays two lines, one representing "Without Grid" (orange) and the other representing "With Grid" (blue). Shaded regions around each line indicate the uncertainty or variability in the data.
### Components/Axes
* **Title:** Sokoban Gridworld: Adjusted Trap Rate
* **X-axis:** Training Examples, with markers at 0, 30, 60, 90, 120, 150, 180, 210, and 240.
* **Y-axis:** Adjusted Trap Rate (%), with markers at 0, 10, 20, 30, 40, 50, 60, 70, and 80.
* **Legend:** Located at the bottom of the chart.
* Orange line: Without Grid
* Blue line: With Grid
### Detailed Analysis
**Without Grid (Orange Line):**
* **Trend:** The line starts high, drops sharply, then increases, and then decreases again, showing a fluctuating pattern.
* **Data Points:**
* 0 Training Examples: Approximately 68%
* 30 Training Examples: Approximately 0%
* 60 Training Examples: Approximately 11%
* 90 Training Examples: Approximately 25%
* 120 Training Examples: Approximately 23%
* 150 Training Examples: Approximately 8%
* 180 Training Examples: Approximately 23%
* 210 Training Examples: Approximately 21%
* 240 Training Examples: Approximately 19%
**With Grid (Blue Line):**
* **Trend:** The line starts high, drops, then increases, and then decreases again, showing a fluctuating pattern.
* **Data Points:**
* 0 Training Examples: Approximately 50%
* 30 Training Examples: Approximately 38%
* 60 Training Examples: Approximately 14%
* 90 Training Examples: Approximately 35%
* 120 Training Examples: Approximately 18%
* 150 Training Examples: Approximately 15%
* 180 Training Examples: Approximately 26%
* 210 Training Examples: Approximately 15%
* 240 Training Examples: Approximately 9%
### Key Observations
* Initially, the "Without Grid" trap rate is higher than the "With Grid" trap rate.
* Both lines show a significant drop in the trap rate between 0 and 60 training examples.
* Both lines fluctuate, indicating that the adjusted trap rate varies with the number of training examples.
* The shaded regions around the lines suggest variability in the trap rate for both conditions.
### Interpretation
The chart compares the adjusted trap rate in a Sokoban Gridworld environment with and without a grid. The data suggests that initially, the absence of a grid leads to a higher trap rate. However, as the number of training examples increases, both conditions exhibit fluctuating trap rates. The variability indicated by the shaded regions suggests that the performance is not consistent and may depend on other factors not explicitly represented in the chart. The "With Grid" line generally shows a lower trap rate after the initial drop, suggesting that the grid provides some benefit in reducing the likelihood of traps.