## Quantum Circuit Diagram: Three-State Quantum Processing Flow
### Overview
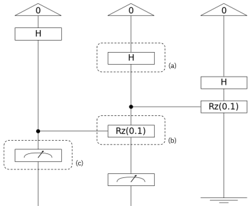
The image depicts three quantum circuit diagrams (labeled a, b, c) illustrating sequential quantum gate operations on a single qubit (labeled "0"). Each diagram shows quantum gates (Hadamard "H" and Rotational "Rz(0.1)"), measurement operations, and connectivity between components. The circuits are vertically stacked with horizontal connections indicating qubit state transitions.
### Components/Axes
- **Qubit**: Labeled "0" at the top of all diagrams, representing the quantum state being manipulated.
- **Gates**:
- **H (Hadamard)**: Appears in all three diagrams, applied to qubit 0.
- **Rz(0.1)**: Rotational gate with phase shift 0.1, present in diagrams (a) and (b).
- **Measurement**: Symbolized by a meter icon (□ with arrow), present in diagrams (b) and (c).
- **Connectivity**: Dotted lines indicate optional or conditional paths (e.g., measurement in diagram b).
- **Labels**: Diagrams are explicitly labeled (a), (b), (c) on the right side.
### Detailed Analysis
1. **Diagram (a)**:
- **Structure**: Qubit 0 → H gate → Rz(0.1) gate.
- **Flow**: Initial Hadamard operation creates superposition, followed by a phase rotation (Rz(0.1)).
- **Notable**: No measurement; represents state preparation only.
2. **Diagram (b)**:
- **Structure**: Qubit 0 → H gate → Rz(0.1) gate → Measurement.
- **Flow**: Adds measurement after Rz(0.1), collapsing the quantum state.
- **Notable**: Dotted line suggests conditional execution or alternative paths.
3. **Diagram (c)**:
- **Structure**: Qubit 0 → H gate → Measurement.
- **Flow**: Simplest configuration, measuring directly after Hadamard.
- **Notable**: Lacks Rz(0.1), emphasizing baseline measurement behavior.
### Key Observations
- **Gate Order Sensitivity**: Diagram (a) vs. (c) shows how Rz(0.1) modifies the qubit state before measurement.
- **Measurement Impact**: Diagram (b) introduces state collapse, altering subsequent operations.
- **Phase Rotation**: Rz(0.1) introduces a small phase shift (0.1 radians), critical for interference effects in quantum algorithms.
### Interpretation
This diagram illustrates foundational quantum processing steps:
1. **State Preparation** (Diagram a): Combines superposition (H) and phase manipulation (Rz) to encode information.
2. **Measurement** (Diagrams b/c): Demonstrates how measurement timing affects outcomes. Diagram (b) shows intermediate measurement after phase rotation, while (c) measures the raw superposition.
3. **Conditional Execution**: The dotted line in (b) implies classical control logic, enabling dynamic circuit adaptation based on measurement results.
The progression from (a) to (c) highlights trade-offs between gate complexity and measurement granularity. The Rz(0.1) gate’s minimal phase shift suggests applications in precision-sensitive algorithms (e.g., quantum sensing), while the absence of Rz in (c) represents a baseline for comparison. The measurement placement directly impacts the qubit’s final state, emphasizing the quantum-classical interface challenges.