## Scatter Plot: GFLOPS vs. Date for DNN Models
### Overview
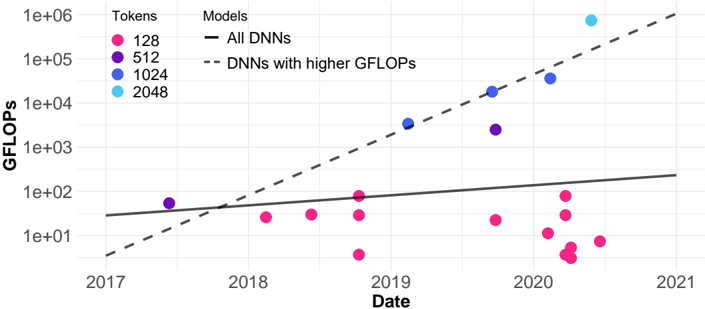
This image presents a scatter plot illustrating the relationship between GFLOPS (Gigafloating point operations per second) and Date for different Deep Neural Network (DNN) models, categorized by the number of tokens used. Two trend lines are included: one for all DNNs and another for DNNs with higher GFLOPS.
### Components/Axes
* **X-axis:** Date, ranging from approximately 2017 to 2021.
* **Y-axis:** GFLOPS, displayed on a logarithmic scale from 1e+00 (1) to 1e+06 (1,000,000).
* **Legend:** Located in the top-right corner, categorizes data points by the number of tokens:
* 128 (Pink)
* 512 (Magenta)
* 1024 (Blue)
* 2048 (Cyan)
* **Lines:**
* "All DNNs" - Solid black line.
* "DNNs with higher GFLOPS" - Dashed grey line.
### Detailed Analysis
The plot shows scattered data points representing individual DNN models. The data points are color-coded based on the number of tokens used.
**Data Point Analysis (Approximate Values):**
* **128 Tokens (Pink):**
* 2017: ~10 GFLOPS
* 2018: ~20 GFLOPS
* 2019: ~10 GFLOPS
* 2020: ~5 GFLOPS, ~10 GFLOPS, ~20 GFLOPS
* **512 Tokens (Magenta):**
* 2018: ~50 GFLOPS
* 2019: ~100 GFLOPS
* 2020: ~50 GFLOPS
* **1024 Tokens (Blue):**
* 2019: ~1000 GFLOPS
* 2020: ~2000 GFLOPS, ~5000 GFLOPS
* **2048 Tokens (Cyan):**
* 2020: ~100000 GFLOPS
**Trend Line Analysis:**
* **"All DNNs" (Black Line):** The line exhibits a slight upward slope, indicating a gradual increase in GFLOPS over time. It starts at approximately 10 GFLOPS in 2017 and ends at approximately 100 GFLOPS in 2021.
* **"DNNs with higher GFLOPS" (Grey Dashed Line):** This line shows a much steeper upward slope, indicating a rapid increase in GFLOPS over time. It starts at approximately 10 GFLOPS in 2017 and ends at approximately 100000 GFLOPS in 2021.
### Key Observations
* There's a clear positive correlation between date and GFLOPS, especially for models with higher GFLOPS.
* The number of tokens appears to be related to GFLOPS, with models using more tokens generally exhibiting higher GFLOPS.
* The spread of data points for 128 tokens is wider than for other token counts, suggesting more variability in GFLOPS for these models.
* The "DNNs with higher GFLOPS" trend line significantly outpaces the "All DNNs" trend line, indicating that the most powerful models are growing in computational demand at a faster rate.
### Interpretation
The data suggests a trend of increasing computational requirements for DNN models over time. The steeper slope of the "DNNs with higher GFLOPS" line indicates that the most advanced models are driving this trend. The correlation between tokens and GFLOPS suggests that model size (as measured by the number of tokens) is a key factor in determining computational demand. The variability in GFLOPS for models with 128 tokens could be due to differences in architecture, training data, or other factors.
The plot highlights the growing need for more powerful hardware to support the development and deployment of increasingly complex DNN models. The divergence between the two trend lines suggests that the gap between the computational requirements of standard models and cutting-edge models is widening, potentially creating challenges for researchers and developers. The logarithmic scale on the Y-axis emphasizes the exponential growth in GFLOPS, particularly for the higher-performing models.