\n
## Diagram: Periodic Function Representation
### Overview
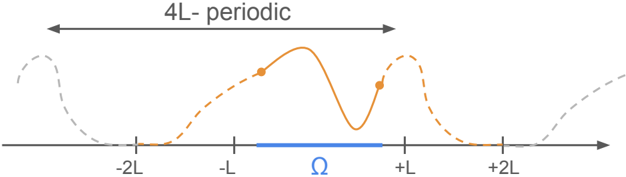
The image depicts a periodic function represented graphically. The function is shown over a range of 4L, with key points marked along the x-axis and a highlighted region labeled as Omega (Ω). The function appears to be a wave-like curve, potentially a trigonometric function.
### Components/Axes
* **X-axis:** A horizontal line representing the independent variable. Marked with values -2L, -L, Ω, +L, and +2L.
* **Y-axis:** Implicit, representing the dependent variable (function value). No explicit scale is provided.
* **Periodic Function:** An orange, dashed-dotted line representing the function's curve.
* **Omega (Ω) Region:** A blue horizontal bar indicating a specific interval on the x-axis.
* **Arrow:** A double-headed arrow labeled "4L - periodic" indicating the period of the function.
* **Key Points:** Two solid circles are placed on the orange curve, marking specific points on the function.
### Detailed Analysis
The diagram shows a periodic function with a period of 4L. The function appears to be centered around the origin.
* **X-axis Markers:**
* -2L: Approximately at the leftmost extent of the visible curve.
* -L: Approximately halfway between -2L and the origin.
* Ω: Located near the origin, slightly to the right.
* +L: Approximately halfway between the origin and +2L.
* +2L: Approximately at the rightmost extent of the visible curve.
* **Function Curve:** The orange curve starts at a low value at -2L, rises to a peak around -L, descends to a minimum near Ω, rises again to a peak around +L, and then descends towards +2L.
* **Key Points on Curve:**
* The first key point is located at approximately x = -0.7L, y = 1.2 (estimated from the curve's height).
* The second key point is located at approximately x = +0.7L, y = -1.2 (estimated from the curve's height).
* **Omega Region:** The blue bar spans from approximately x = -0.3L to x = +0.3L.
### Key Observations
* The function is not symmetrical about the y-axis, suggesting it is not an even function.
* The function has a period of 4L, as indicated by the arrow.
* The Omega region appears to be centered around the origin.
* The two marked points on the curve suggest a potential relationship or symmetry within the function.
### Interpretation
The diagram illustrates a periodic function, likely used to demonstrate concepts in mathematics or physics, such as wave behavior or oscillatory systems. The "4L - periodic" label emphasizes the function's repeating nature over an interval of 4L. The Omega (Ω) region might represent a specific domain of interest or a boundary condition within a larger problem. The marked points on the curve could be significant values or solutions related to the function. The lack of a defined y-axis scale suggests the diagram is focused on the function's shape and periodicity rather than precise numerical values. The diagram is a conceptual representation, and the exact function is not defined.