# Technical Data Extraction: Model Layer Analysis Chart
## 1. General Overview
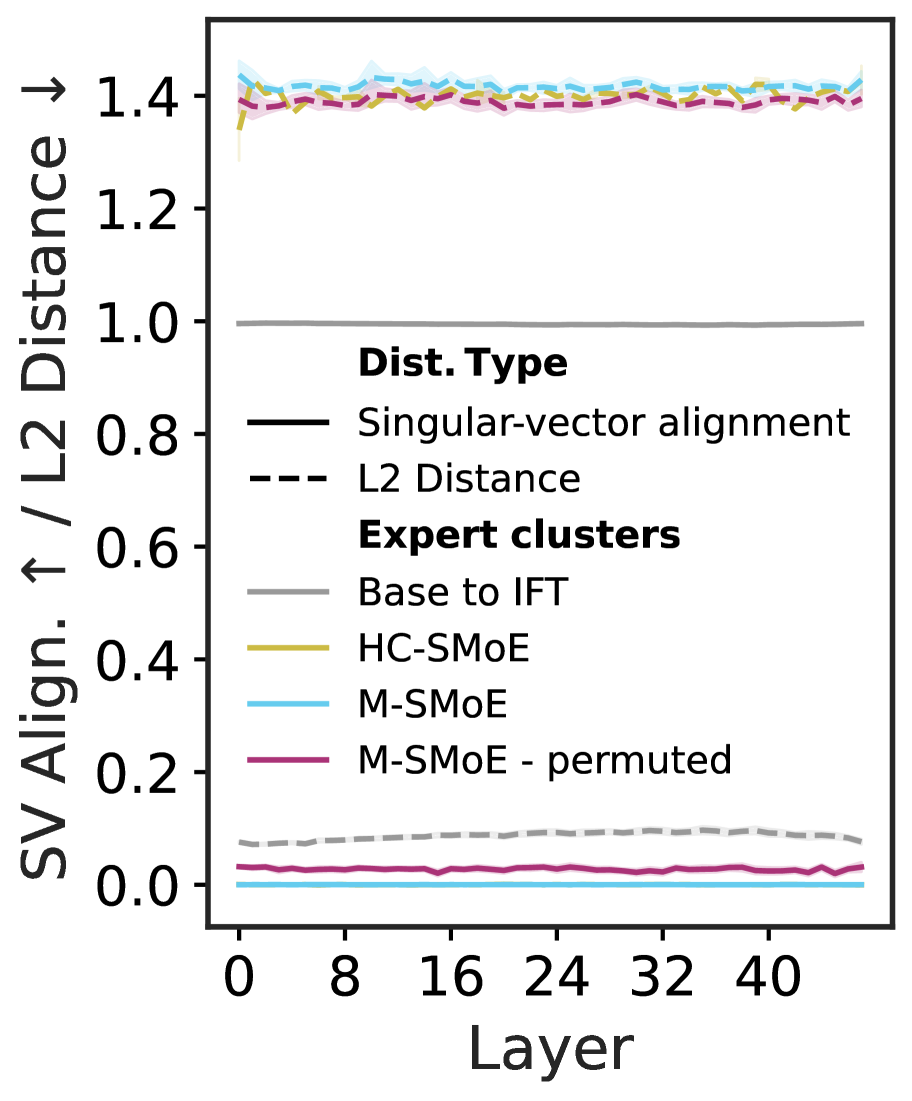
This image is a line graph plotting two different metrics across various model layers. It compares different expert clustering methods and a baseline model transition.
## 2. Axis Information
* **Y-Axis Label:** SV Align. ↑ / L2 Distance ↓
* **Note:** The upward arrow indicates higher is better for Singular-vector alignment; the downward arrow indicates lower is better for L2 Distance.
* **Scale:** 0.0 to 1.4 (increments of 0.2).
* **X-Axis Label:** Layer
* **Scale:** 0 to 48 (labeled markers at 0, 8, 16, 24, 32, 40).
## 3. Legend Information
The legend is divided into two categories:
### Dist. Type (Line Style)
| Style | Metric |
| :--- | :--- |
| Solid Line (—) | Singular-vector alignment |
| Dashed Line (---) | L2 Distance |
### Expert clusters (Color Coding)
| Color | Method |
| :--- | :--- |
| Grey | Base to IFT |
| Gold/Yellow | HC-SMoE |
| Light Blue | M-SMoE |
| Magenta/Purple | M-SMoE - permuted |
## 4. Data Trends and Observations
### Singular-vector alignment (Solid Lines)
* **Base to IFT (Grey):** Maintains a constant horizontal line at exactly **1.0** across all layers.
* **M-SMoE (Light Blue):** Remains constant at approximately **0.0** across all layers.
* **M-SMoE - permuted (Magenta):** Remains constant at a very low value, slightly above 0.0 (approx. **0.02 - 0.03**).
* **HC-SMoE (Gold):** This line is not visible in the lower section of the graph, suggesting it may overlap with other data or is primarily represented in the L2 distance section.
### L2 Distance (Dashed Lines)
All L2 Distance metrics are clustered at the top of the chart, significantly higher than the alignment metrics.
* **M-SMoE (Light Blue):** Highest L2 distance, fluctuating slightly around **1.42**.
* **HC-SMoE (Gold):** Fluctuates between **1.38 and 1.41**.
* **M-SMoE - permuted (Magenta):** Fluctuates between **1.38 and 1.40**.
* **Base to IFT (Grey):** This dashed line is located at the bottom of the graph, fluctuating slightly around **0.08 - 0.10**, indicating a much lower L2 distance compared to the SMoE variants.
## 5. Summary of Key Findings
* There is a massive disparity between the L2 Distance of SMoE-based clusters (approx. 1.4) and the Base to IFT transition (approx. 0.1).
* Conversely, the Singular-vector alignment for Base to IFT is perfect (1.0), while all SMoE variants show near-zero alignment across all layers.
* The "M-SMoE - permuted" variant shows slightly higher alignment and slightly lower L2 distance than the standard "M-SMoE" in some layers, but they remain very close.