## Diagram: Network Flow
### Overview
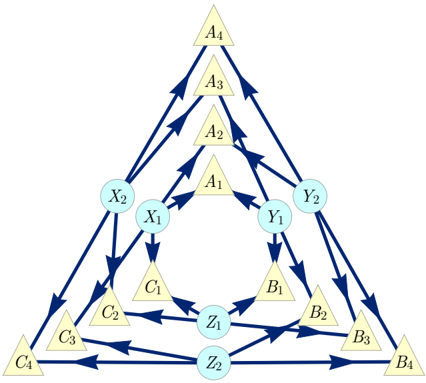
The image is a network diagram depicting relationships and flow between different nodes. The nodes are labeled with letters (A, B, C, X, Y, Z) and numbers (1-4). The connections between the nodes are represented by blue arrows, indicating the direction of flow. The diagram is arranged in a roughly triangular shape.
### Components/Axes
* **Nodes:** The nodes are represented by either triangles (pale yellow fill) or circles (light blue fill).
* Triangles: A1, A2, A3, A4, B1, B2, B3, B4, C1, C2, C3, C4
* Circles: X1, X2, Y1, Y2, Z1, Z2
* **Connections:** The connections are represented by blue arrows, indicating the direction of flow between the nodes.
* **Layout:** The diagram is arranged in a triangular shape, with the 'A' nodes at the top, 'B' nodes at the bottom-right, and 'C' nodes at the bottom-left. The 'X', 'Y', and 'Z' nodes are positioned within the triangle.
### Detailed Analysis or ### Content Details
* **Top (A Nodes):**
* A1 is connected to X1, Y1, A2.
* A2 is connected to X2, Y2, A3.
* A3 is connected to X2, Y2, A4.
* A4 is connected to X2, Y2.
* **Bottom-Left (C Nodes):**
* C1 is connected to X1, Z1.
* C2 is connected to X2, Z1.
* C3 is connected to X2, Z2.
* C4 is connected to X2, Z2.
* **Bottom-Right (B Nodes):**
* B1 is connected to Y1, Z1.
* B2 is connected to Y2, Z1.
* B3 is connected to Y2, Z2.
* B4 is connected to Y2, Z2.
* **Inner Nodes (X, Y, Z):**
* X1 is connected to C1, Z1.
* X2 is connected to C2, C3, C4, Z2.
* Y1 is connected to B1, Z1.
* Y2 is connected to B2, B3, B4, Z2.
* Z1 is connected to Z2.
### Key Observations
* The 'A' nodes form a hierarchy, with flow from A1 to A4.
* The 'X' and 'Y' nodes act as intermediaries between the 'A' nodes and the 'C' and 'B' nodes, respectively.
* The 'Z' nodes appear to be the final destination of the flow, with Z2 being the ultimate sink.
* There is a cyclical pattern in the center of the diagram, involving A1, X1, Y1, and Z1.
### Interpretation
The diagram represents a network flow model, where the nodes represent different entities or states, and the arrows represent the flow of information or resources between them. The hierarchical structure of the 'A' nodes suggests a process with multiple stages. The 'X', 'Y', and 'Z' nodes act as intermediaries or processing units. The cyclical pattern in the center suggests a feedback loop or iterative process. The overall structure of the diagram implies a complex system with interconnected components and a defined flow of information or resources.