## Scatter Plot: Factual vs. Associative Hallucinations
### Overview
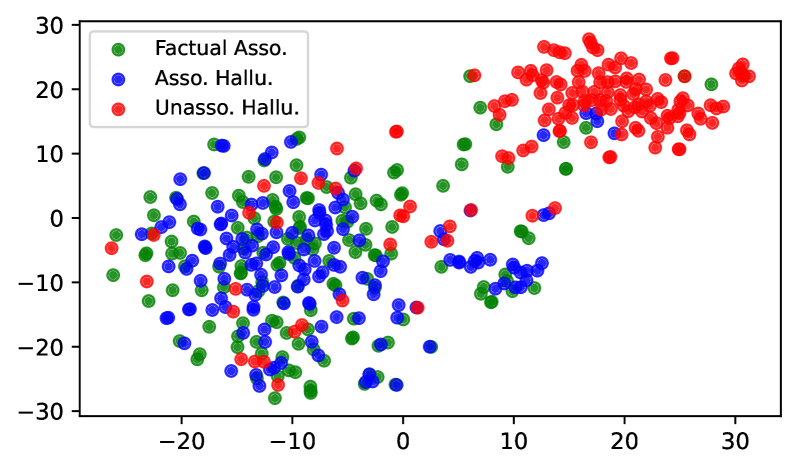
The image is a scatter plot visualizing the distribution of three categories: "Factual Asso.", "Asso. Hallu.", and "Unasso. Hallu." The plot displays data points in a two-dimensional space, with no explicit x and y axis labels. The data points are color-coded: green for "Factual Asso.", blue for "Asso. Hallu.", and red for "Unasso. Hallu.". The plot shows some clustering of the data points, suggesting potential relationships between the categories.
### Components/Axes
* **X-axis:** No explicit label, but ranges from approximately -25 to 30.
* **Y-axis:** No explicit label, but ranges from approximately -30 to 30.
* **Legend (Top-Left):**
* Green: "Factual Asso."
* Blue: "Asso. Hallu."
* Red: "Unasso. Hallu."
### Detailed Analysis
* **Factual Asso. (Green):**
* Data points are scattered across the plot.
* Concentrations appear in the bottom-left quadrant (x: -25 to -5, y: -30 to -10) and the top-right quadrant (x: 10 to 30, y: 10 to 30).
* **Asso. Hallu. (Blue):**
* Data points are primarily concentrated in the bottom-left quadrant (x: -25 to 0, y: -30 to 10).
* Some overlap with "Factual Asso." in this region.
* **Unasso. Hallu. (Red):**
* Data points are mainly clustered in the top-right quadrant (x: 5 to 30, y: 10 to 30).
* Some overlap with "Factual Asso." in this region.
* A few points are scattered in the bottom-left quadrant.
### Key Observations
* The "Asso. Hallu." category appears to be distinct from the "Unasso. Hallu." category, with minimal overlap.
* The "Factual Asso." category is more dispersed and overlaps with both "Asso. Hallu." and "Unasso. Hallu."
* There are two distinct clusters, one in the bottom-left and one in the top-right.
### Interpretation
The scatter plot suggests that "Associative Hallucinations" and "Unassociated Hallucinations" may represent distinct phenomena, as indicated by their separate clustering. "Factual Associations" seem to be more broadly distributed, potentially indicating that they can occur in conjunction with both types of hallucinations or independently. The lack of axis labels makes it difficult to interpret the specific dimensions along which these categories are being differentiated. Further information about the features represented by the x and y axes would be needed to draw more specific conclusions.