\n
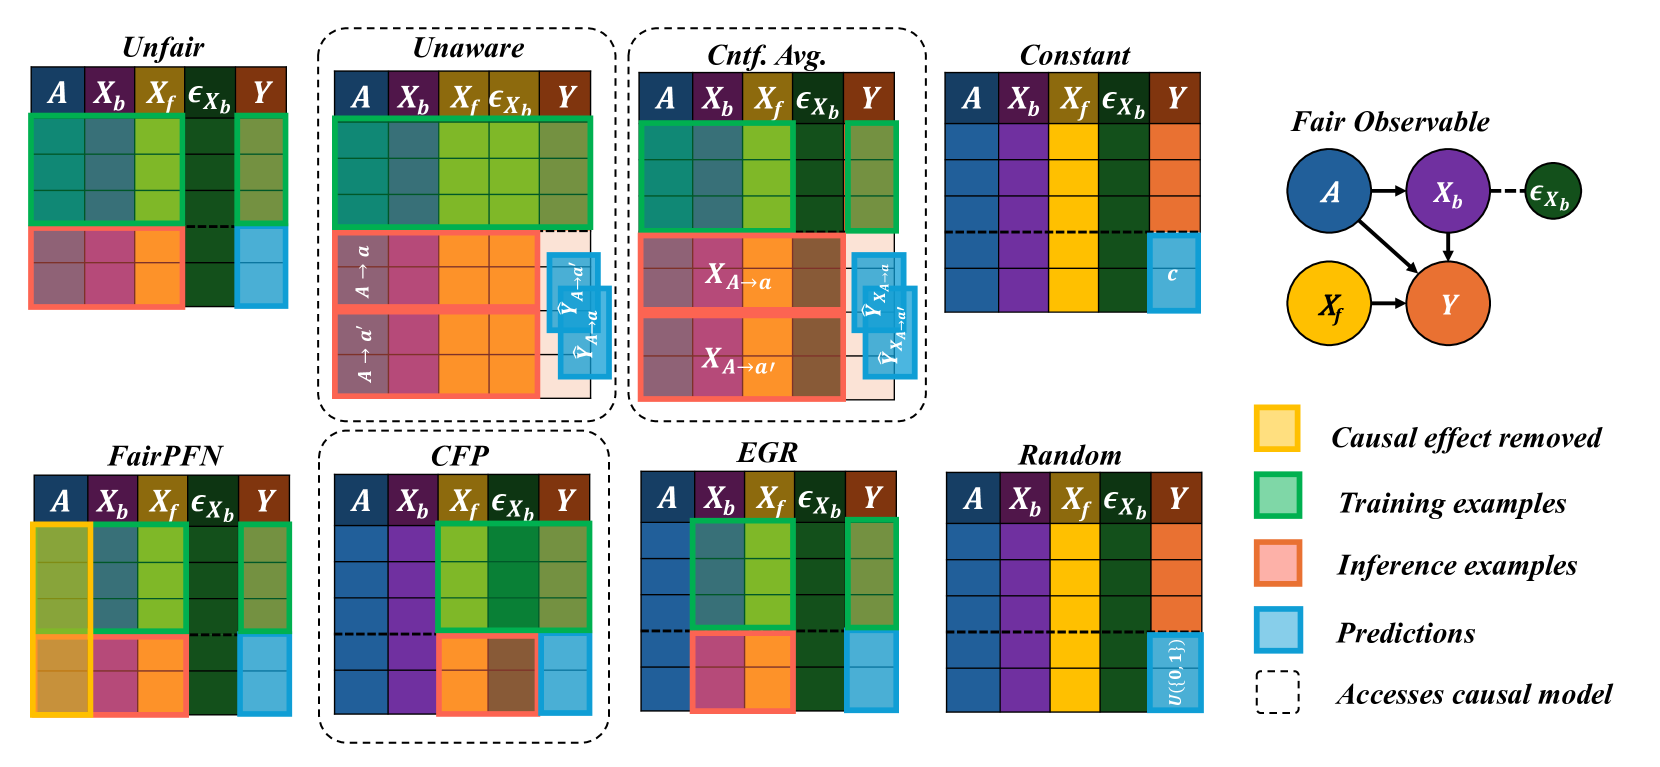
## Heatmap: Fairness Interventions
### Overview
The image presents a series of heatmaps comparing different fairness interventions in a causal model. Each heatmap represents a different intervention strategy (Unfair, Unaware, Cnf. Avg., Constant, FairPFN, CFP, EGR, Random) and visualizes the relationship between variables A, Xb, Xf, εXb, and Y. The color intensity indicates the strength of the relationship, with red representing strong positive correlation, blue representing strong negative correlation, and shades in between representing varying degrees of correlation. A diagram in the top-right corner illustrates the causal model being used. A legend explains the color coding for different types of data points.
### Components/Axes
* **Columns:** Represent the variables A, Xb, Xf, εXb, and Y.
* **Rows:** Represent the relationships between these variables.
* **Color Scale:** Ranges from blue (negative correlation) to red (positive correlation).
* **Legend:**
* Solid Blue: Causal effect removed.
* Green: Training examples.
* Purple: Inference examples.
* Light Blue: Predictions.
* Dashed Black: Accesses causal model.
* **Causal Model Diagram:** Shows the relationships between A, Xb, Xf, εXb, and Y.
### Detailed Analysis
Each heatmap is a 5x5 grid, representing the correlation between each pair of variables. I will describe each heatmap individually, noting the dominant color patterns and any significant deviations.
**1. Unfair:**
* Dominant colors: Red and purple.
* Strong positive correlations are visible between A and Xb, A and Xf, Xb and Y, and Xf and Y.
* Purple (inference examples) are prominent in the upper-left quadrant.
* Green (training examples) are prominent in the lower-right quadrant.
**2. Unaware:**
* Dominant colors: Red, purple, and some blue.
* Similar to "Unfair" but with some blue appearing in the A-Xb and A-Xf relationships.
* Strong positive correlations remain between Xb and Y, and Xf and Y.
**3. Cnf. Avg.:**
* Dominant colors: Red, purple, and blue.
* Significant blue appears in the A-Xb and A-Xf relationships, indicating a reduction in correlation.
* Strong positive correlations remain between Xb and Y, and Xf and Y, but are slightly less intense than in "Unfair" and "Unaware".
**4. Constant:**
* Dominant colors: Blue and purple.
* Strong negative correlations are visible between A and Xb, and A and Xf.
* The correlation between Xb and Y, and Xf and Y is significantly reduced.
**5. FairPFN:**
* Dominant colors: Blue and purple.
* Strong negative correlations are visible between A and Xb, and A and Xf.
* The correlation between Xb and Y, and Xf and Y is significantly reduced.
**6. CFP:**
* Dominant colors: Blue and purple.
* Strong negative correlations are visible between A and Xb, and A and Xf.
* The correlation between Xb and Y, and Xf and Y is significantly reduced.
**7. EGR:**
* Dominant colors: Blue and purple.
* Strong negative correlations are visible between A and Xb, and A and Xf.
* The correlation between Xb and Y, and Xf and Y is significantly reduced.
**8. Random:**
* Dominant colors: Mixed, with a relatively even distribution of red, blue, and purple.
* No clear patterns or strong correlations are visible.
**Causal Model Diagram:**
* A influences Xb and Xf.
* Xb influences Y.
* Xf influences Y.
* εXb is an error term influencing Xb.
* The diagram shows a directed acyclic graph (DAG) representing the causal relationships.
* The variable 'c' is shown as a constant.
* The variable 'u' is shown as a value of 0.10.
### Key Observations
* The "Unfair" intervention exhibits the strongest positive correlations between A and the intermediate variables (Xb, Xf) and between these variables and the outcome Y.
* Interventions like "Constant", "FairPFN", "CFP", and "EGR" effectively reduce the correlation between A and the intermediate variables, leading to a more fair outcome.
* The "Random" intervention results in a lack of clear patterns, suggesting it does not systematically address fairness.
* The color patterns consistently show a trade-off: reducing the correlation between A and the intermediate variables often leads to a weaker correlation between these variables and the outcome Y.
### Interpretation
The heatmaps demonstrate the impact of different fairness interventions on a causal model. The "Unfair" intervention represents a scenario where the model does not account for fairness, resulting in strong biases. The other interventions attempt to mitigate these biases by reducing the influence of the sensitive attribute A on the intermediate variables.
The interventions that successfully reduce the correlation between A and Xb/Xf (e.g., "Constant", "FairPFN", "CFP", "EGR") achieve fairness by removing the causal effect of A on the outcome Y. However, this often comes at the cost of predictive accuracy, as the model relies less on the intermediate variables.
The "Random" intervention highlights the importance of systematic approaches to fairness. Simply introducing randomness does not guarantee a fair outcome.
The causal model diagram provides a visual representation of the underlying relationships between the variables, helping to understand how the interventions affect the causal pathways. The diagram shows that A has a direct influence on Xb and Xf, which in turn influence Y. By intervening on these pathways, the fairness interventions aim to break the causal link between A and Y.
The data suggests that achieving fairness requires careful consideration of the trade-off between fairness and accuracy. The optimal intervention strategy will depend on the specific application and the desired balance between these two objectives. The heatmaps provide a valuable tool for visualizing and comparing the effects of different interventions, allowing for informed decision-making.