## Scatter Plot: Accuracy of Individual Treatment Effect (ITE) Estimation
### Overview
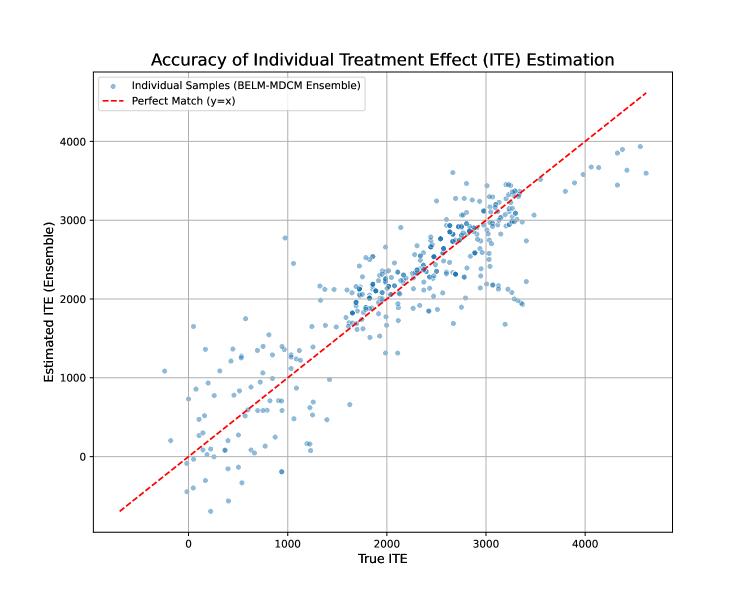
The image is a scatter plot comparing the accuracy of estimated Individual Treatment Effects (ITE) against their true values. The plot uses blue dots to represent individual samples from a BELM-MDCM ensemble and a red dashed line to indicate the "Perfect Match" (y=x), where estimated ITE equals true ITE.
### Components/Axes
- **Title**: "Accuracy of Individual Treatment Effect (ITE) Estimation" (top-center).
- **X-axis**: "True ITE" (ranging from 0 to 4000).
- **Y-axis**: "Estimated ITE (Ensemble)" (ranging from 0 to 4000).
- **Legend**:
- **Blue dots**: "Individual Samples (BELM-MDCM Ensemble)" (top-left).
- **Red dashed line**: "Perfect Match (y=x)" (top-left).
### Detailed Analysis
- **Data Points**:
- Blue dots (individual samples) are scattered across the plot, with most clustered near the red dashed line.
- Some points deviate from the line, with a few above (overestimation) and below (underestimation) the perfect match.
- The spread of points suggests variability in estimation accuracy, with no clear outliers.
- **Trends**:
- The red dashed line (y=x) acts as a reference for perfect estimation.
- The blue dots generally follow a positive linear trend, indicating that higher true ITE values correspond to higher estimated ITE values.
- The density of points increases near the line, suggesting the ensemble method performs well for mid-range ITE values.
### Key Observations
- The majority of estimated ITE values align closely with the true ITE, as seen by the concentration of blue dots near the red line.
- The spread of points indicates that while the ensemble method is generally accurate, there is some variability in estimation precision.
- No extreme outliers are visible, but the data shows a slight tendency for overestimation at higher true ITE values (points above the line).
### Interpretation
The plot demonstrates that the BELM-MDCM ensemble method provides a reliable estimation of ITE, with most individual samples closely matching the true ITE. The red dashed line (y=x) serves as a benchmark, and the proximity of blue dots to this line confirms the method's effectiveness. However, the observed spread suggests that the estimation is not perfectly consistent, potentially due to factors like sample heterogeneity or model limitations. This visualization highlights the trade-off between accuracy and variability in ITE estimation, emphasizing the need for further refinement to minimize deviations from the perfect match.