## Chart: Reachable Sets Comparison
### Overview
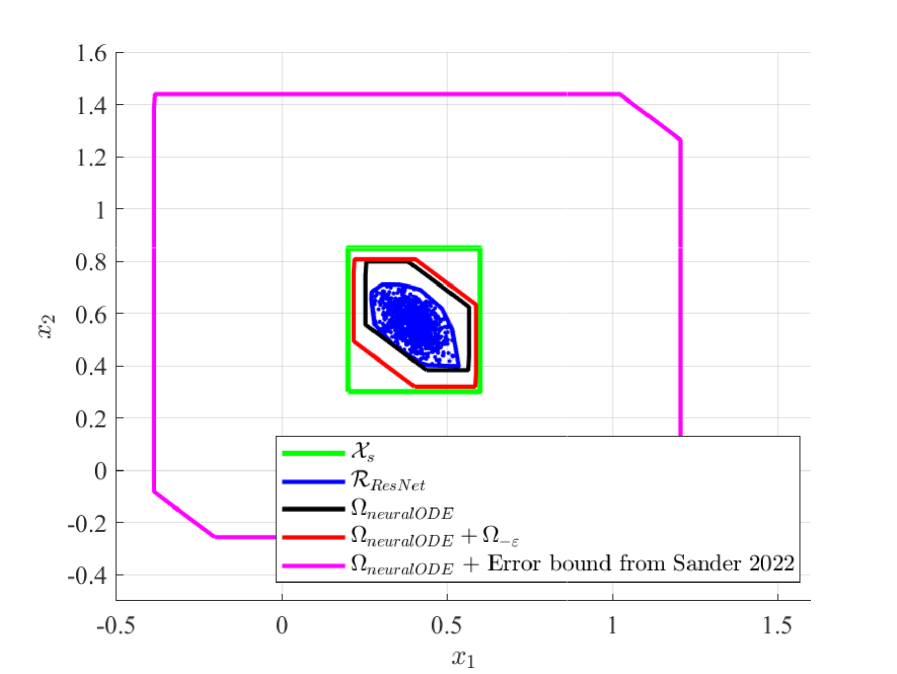
The image is a 2D plot comparing reachable sets obtained using different methods: ResNet, neuralODE, and error bounds from Sander 2022. The plot shows the regions in the x1-x2 plane that the system can reach under different conditions or approximations.
### Components/Axes
* **X-axis:** x1, ranging from -0.5 to 1.5
* **Y-axis:** x2, ranging from -0.5 to 1.6
* **Legend:** Located in the bottom-right corner of the plot.
* Green: Xs
* Blue: RResNet
* Black: ΩneuralODE
* Red: ΩneuralODE + Ω−ε
* Magenta: ΩneuralODE + Error bound from Sander 2022
### Detailed Analysis
* **Xs (Green):** A rectangular region centered around (0.5, 0.6). The bottom-left corner is approximately at (0.2, 0.3) and the top-right corner is approximately at (0.7, 0.85).
* **RResNet (Blue):** A scattered set of points contained within the other regions, concentrated around (0.4, 0.6). The points are densely packed, forming an irregular shape.
* **ΩneuralODE (Black):** A polygon enclosing the blue points. The vertices are approximately at (0.25, 0.4), (0.4, 0.8), (0.6, 0.8), (0.7, 0.6), (0.6, 0.4), and (0.3, 0.3).
* **ΩneuralODE + Ω−ε (Red):** A polygon slightly larger than the black polygon. The vertices are approximately at (0.15, 0.3), (0.3, 0.8), (0.7, 0.8), (0.8, 0.6), (0.7, 0.3), and (0.2, 0.2).
* **ΩneuralODE + Error bound from Sander 2022 (Magenta):** A large polygon encompassing all other regions. The vertices are approximately at (-0.4, -0.3), (-0.4, 1.45), (0.8, 1.45), (1.4, 1.45), (1.4, -0.3), and (-0.4, -0.3).
### Key Observations
* The RResNet region (blue) is contained within the ΩneuralODE region (black).
* The ΩneuralODE + Ω−ε region (red) is slightly larger than the ΩneuralODE region (black).
* The ΩneuralODE + Error bound from Sander 2022 region (magenta) is significantly larger than all other regions.
* The Xs region (green) is a rectangular box that contains the other regions.
### Interpretation
The plot illustrates the reachable sets obtained using different methods. The RResNet method provides a specific set of reachable states, while the neuralODE method provides a larger set that encompasses the RResNet set. Adding the error term Ω−ε to the neuralODE method further expands the reachable set. The error bound from Sander 2022 provides the largest reachable set, indicating a more conservative estimate of the system's possible states. The Xs region represents the state space. The plot suggests that the RResNet method provides a tighter estimate of the reachable set compared to the neuralODE method with error bounds. The error bound from Sander 2022 provides a guaranteed bound on the reachable set, but it may be overly conservative.