## Multi-Line Chart: Model Performance Comparison Across Mathematical Benchmarks
### Overview
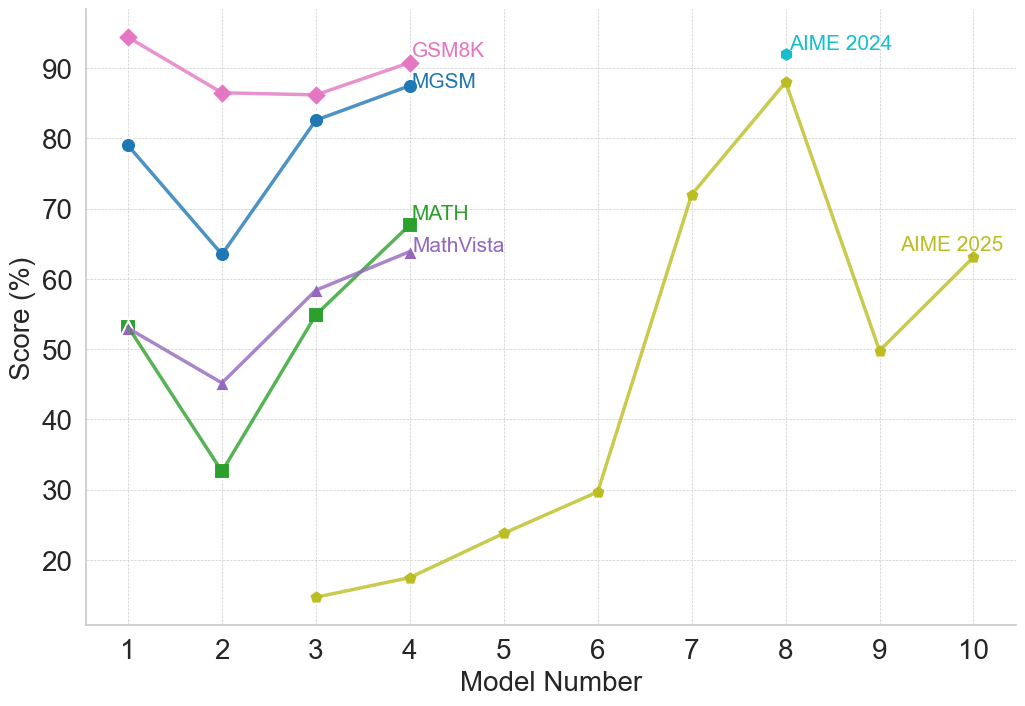
This is a multi-line chart comparing the performance of 10 different models (numbered 1 through 10) on five distinct mathematical reasoning benchmarks. The chart plots the score percentage for each model on each benchmark, revealing trends in model capability across different types of mathematical problems.
### Components/Axes
* **X-Axis:** Labeled "Model Number". It is a categorical axis with discrete integer markers from 1 to 10.
* **Y-Axis:** Labeled "Score (%)". It is a linear scale ranging from 20 to 90, with major gridlines at intervals of 10.
* **Legend/Data Series:** There are five distinct lines, each representing a benchmark, identified by color and marker shape. The legend is embedded directly on the chart, with labels placed near the end of their respective lines.
* **GSM8K:** Pink line with diamond markers.
* **MGSM:** Blue line with circle markers.
* **MATH:** Green line with square markers.
* **MathVista:** Purple line with triangle markers.
* **AIME 2025:** Yellow-green line with circle markers.
* **AIME 2024:** A single cyan diamond data point at Model 8.
### Detailed Analysis
**Trend Verification & Data Point Extraction (Approximate Values):**
1. **GSM8K (Pink, Diamonds):**
* **Trend:** Starts very high, dips at model 2, plateaus, then recends slightly upward.
* **Points:** Model 1: ~95%, Model 2: ~86%, Model 3: ~86%, Model 4: ~91%.
2. **MGSM (Blue, Circles):**
* **Trend:** Shows a sharp V-shaped recovery. Starts high, drops significantly at model 2, then climbs back up.
* **Points:** Model 1: ~79%, Model 2: ~64%, Model 3: ~83%, Model 4: ~88%.
3. **MATH (Green, Squares):**
* **Trend:** Exhibits a strong upward trend after an initial dip. The slope from model 2 to 4 is steep.
* **Points:** Model 1: ~53%, Model 2: ~33%, Model 3: ~55%, Model 4: ~68%.
4. **MathVista (Purple, Triangles):**
* **Trend:** Follows a similar pattern to MATH but with less extreme values—a dip followed by a steady increase.
* **Points:** Model 1: ~53%, Model 2: ~45%, Model 3: ~58%, Model 4: ~64%.
5. **AIME 2025 (Yellow-Green, Circles):**
* **Trend:** This series spans models 3-10 and shows high volatility. It starts very low, climbs dramatically to a peak at model 8, drops sharply, then recovers slightly.
* **Points:** Model 3: ~15%, Model 4: ~18%, Model 5: ~24%, Model 6: ~30%, Model 7: ~72%, Model 8: ~88%, Model 9: ~50%, Model 10: ~63%.
6. **AIME 2024 (Cyan, Single Diamond):**
* **Trend:** Not applicable (single point).
* **Point:** Model 8: ~92%.
**Spatial Grounding:** The legend labels are positioned in the upper portion of the chart, generally aligned near the final data point of their respective lines (e.g., "GSM8K" is top-left, "AIME 2025" is far right). The "AIME 2024" label is placed directly above its single data point at Model 8.
### Key Observations
1. **Consistent Dip at Model 2:** Four of the five benchmarks (GSM8K, MGSM, MATH, MathVista) show a performance drop for Model 2 compared to Model 1.
2. **Strong Recovery:** Models 3 and 4 show significant recovery and improvement across the initial four benchmarks.
3. **Benchmark Difficulty Spectrum:** There is a clear hierarchy in scores. GSM8K and MGSM generally yield the highest scores (mostly above 60%), MATH and MathVista are in the middle range, and AIME 2025 starts extremely low, indicating it is likely the most challenging benchmark for the earlier models.
4. **AIME 2025 Volatility:** Performance on AIME 2025 is highly non-linear, with a massive jump between models 6 and 7 (~30% to ~72%) and a subsequent crash between models 8 and 9 (~88% to ~50%).
5. **Model 8 Peak:** Model 8 achieves the highest observed score on the chart (~92% on AIME 2024) and the highest on AIME 2025 (~88%), suggesting it is exceptionally strong on this competition-style benchmark.
### Interpretation
This chart visualizes the progression of mathematical reasoning capabilities across a series of models. The data suggests that **model architecture or training methodology has a profound and non-uniform impact on different types of mathematical problems.**
* The synchronized dip at Model 2 implies a potential architectural choice or training regime that was broadly detrimental to mathematical reasoning, which was subsequently corrected or improved upon in Models 3 and 4.
* The stark difference in score ranges between benchmarks like GSM8K (elementary math word problems) and AIME (advanced competition math) highlights the varying difficulty and specificity of these evaluation sets. A model's performance is not transferable uniformly across all math domains.
* The dramatic volatility in the AIME 2025 line is particularly noteworthy. It suggests that performance on highly complex, competition-level problems may be fragile—small changes in a model can lead to outsized gains or losses. The peak at Model 8 followed by a drop could indicate overfitting to certain problem types or a lack of robustness.
* The single, high AIME 2024 point for Model 8 reinforces its standout performance on competition math, but the lack of data for other models on this benchmark limits broader comparison.
**In essence, the chart tells a story of initial struggle (Model 2), recovery and specialization (Models 3-4), and the emergence of a model (Model 8) with exceptional, though potentially brittle, prowess on the most difficult benchmark presented.** The absence of model names means we cannot correlate these trends with specific public models, but the pattern itself is a valuable map of capability development.