## Power Curve Comparison: Manufacturer vs Synthetic Models
### Overview
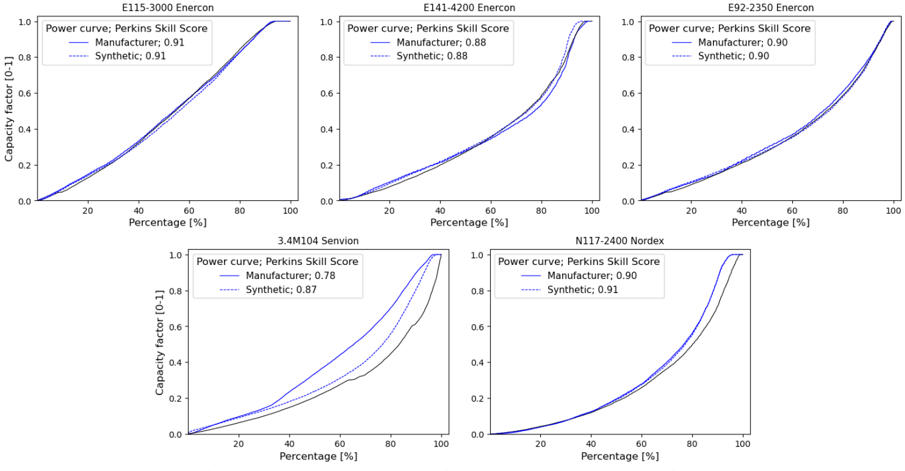
The image contains five power curve graphs comparing Manufacturer and Synthetic models across different wind turbine types (Enercon and Nordex). Each graph shows capacity factor (0-1) against percentage (%) from 0 to 100. Solid lines represent Manufacturer data, dashed lines represent Synthetic data, with Perkins Skill Scores provided in legends.
### Components/Axes
- **X-axis**: Percentage (%) from 0 to 100 (all graphs)
- **Y-axis**: Capacity Factor (0-1) (all graphs)
- **Legends**:
- Manufacturer (solid line) with Perkins Skill Score
- Synthetic (dashed line) with Perkins Skill Score
- **Graph Titles**:
1. E115-3000 Enercon
2. E141-4200 Enercon
3. E92-2350 Enercon
4. 3.4M104 Servion
5. N117-2400 Nordex
### Detailed Analysis
1. **E115-3000 Enercon**
- Manufacturer: 0.91 Perkins Skill Score (solid line)
- Synthetic: 0.91 Perkins Skill Score (dashed line)
- Both lines show identical upward trends, reaching ~0.8 capacity factor at 100%.
2. **E141-4200 Enercon**
- Manufacturer: 0.88 Perkins Skill Score (solid line)
- Synthetic: 0.88 Perkins Skill Score (dashed line)
- Similar trend to E115-3000, with slight divergence at 80% (Manufacturer: ~0.75, Synthetic: ~0.72).
3. **E92-2350 Enercon**
- Manufacturer: 0.90 Perkins Skill Score (solid line)
- Synthetic: 0.90 Perkins Skill Score (dashed line)
- Manufacturer line consistently above Synthetic, reaching ~0.85 capacity factor at 100%.
4. **3.4M104 Servion**
- Manufacturer: 0.78 Perkins Skill Score (solid line)
- Synthetic: 0.87 Perkins Skill Score (dashed line)
- Synthetic line surpasses Manufacturer at ~60%, reaching ~0.8 capacity factor at 100%.
5. **N117-2400 Nordex**
- Manufacturer: 0.90 Perkins Skill Score (solid line)
- Synthetic: 0.91 Perkins Skill Score (dashed line)
- Synthetic line slightly outperforms Manufacturer, with both reaching ~0.85 capacity factor at 100%.
### Key Observations
- **Consistency**: Manufacturer lines generally maintain higher capacity factors than Synthetic lines, except in 3.4M104 Servion.
- **Skill Score Correlation**: Higher Perkins Skill Scores (0.90-0.91) correlate with better performance in most cases.
- **Anomaly**: 3.4M104 Servion shows Synthetic outperforming Manufacturer despite lower Manufacturer Skill Score (0.78 vs 0.87).
### Interpretation
The data suggests Manufacturer models typically demonstrate superior capacity factors, but Synthetic models can outperform in specific configurations (e.g., 3.4M104 Servion). The Perkins Skill Scores appear to reflect model accuracy, with higher scores aligning with better performance in most cases. The exception in 3.4M104 Servion indicates potential model-specific factors influencing outcomes, warranting further investigation into synthetic data generation methods for that configuration.