## Line Chart: Surprisal vs. Layer
### Overview
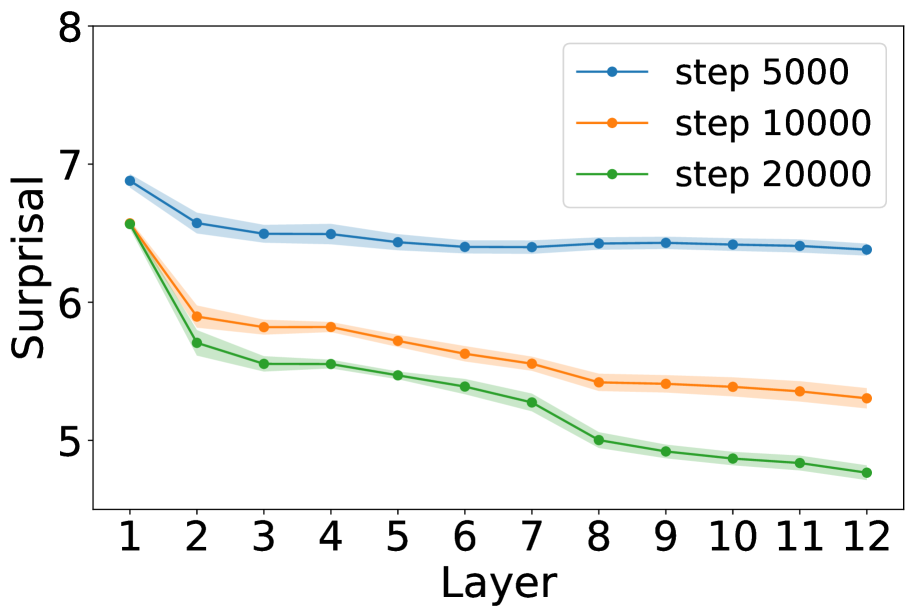
The image is a line chart showing the relationship between "Surprisal" and "Layer" for three different training steps: 5000, 10000, and 20000. The x-axis represents the layer number (from 1 to 12), and the y-axis represents the surprisal value (from 5 to 8). Each line represents a different training step, with shaded regions indicating the uncertainty or variance around the mean surprisal value.
### Components/Axes
* **X-axis:** "Layer" - Ranges from 1 to 12 in integer increments.
* **Y-axis:** "Surprisal" - Ranges from 5 to 8 in integer increments.
* **Legend:** Located in the top-right corner.
* Blue line: "step 5000"
* Orange line: "step 10000"
* Green line: "step 20000"
### Detailed Analysis
* **Step 5000 (Blue):** The surprisal starts at approximately 6.9 at layer 1, decreases to about 6.5 by layer 2, and then plateaus around 6.4 for the remaining layers. The shaded region indicates a small variance.
* Layer 1: ~6.9
* Layer 2: ~6.5
* Layer 12: ~6.35
* **Step 10000 (Orange):** The surprisal starts at approximately 6.5 at layer 1, decreases to about 5.9 by layer 2, and continues to decrease gradually to approximately 5.3 by layer 12. The shaded region indicates a small variance.
* Layer 1: ~6.5
* Layer 2: ~5.9
* Layer 12: ~5.3
* **Step 20000 (Green):** The surprisal starts at approximately 6.5 at layer 1, decreases sharply to about 5.7 by layer 2, and continues to decrease gradually to approximately 4.8 by layer 12. The shaded region indicates a small variance.
* Layer 1: ~6.5
* Layer 2: ~5.7
* Layer 12: ~4.8
### Key Observations
* All three lines show a decreasing trend in surprisal as the layer number increases.
* The "step 20000" line (green) consistently has the lowest surprisal values across all layers.
* The "step 5000" line (blue) has the highest surprisal values and plateaus after the initial drop.
* The "step 10000" line (orange) falls between the other two lines and shows a more gradual decrease.
### Interpretation
The chart suggests that as the training step increases (from 5000 to 20000), the surprisal generally decreases across all layers. This indicates that the model becomes more predictable or less "surprised" by the input as it is trained further. The initial layers seem to have a more significant impact on reducing surprisal, as evidenced by the steeper drops between layers 1 and 2 for all three training steps. The plateauing of the "step 5000" line suggests that the model may have reached a point of diminishing returns in terms of reducing surprisal after 5000 training steps, while the other two models continue to improve.