\n
## Diagram: Model Prediction vs. Ground Truth
### Overview
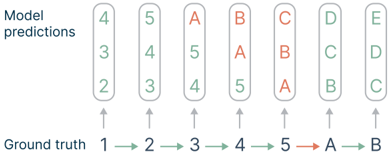
The image presents a diagram comparing model predictions to the ground truth for a sequence of data points. It visually represents the accuracy of a model's predictions against the actual values. The diagram consists of paired vertical rectangles, with the top rectangle representing the model's prediction and the bottom rectangle representing the ground truth. Arrows connect the ground truth values to their corresponding model predictions.
### Components/Axes
The diagram has two main sections:
* **Model predictions:** Labeled on the left side of the image.
* **Ground truth:** Labeled at the bottom of the image.
The ground truth values are numerical (1, 2, 3, 4, 5) and alphabetical (A, B). The model predictions also consist of numerical (2, 3, 4, 5) and alphabetical (A, B, C, D, E) values. Arrows point upwards from each ground truth value to its corresponding model prediction.
### Detailed Analysis
The diagram shows the following pairings of ground truth and model predictions:
1. Ground Truth: 1 -> Model Prediction: 4
2. Ground Truth: 2 -> Model Prediction: 5
3. Ground Truth: 3 -> Model Prediction: A
4. Ground Truth: 4 -> Model Prediction: B
5. Ground Truth: 5 -> Model Prediction: C
6. Ground Truth: A -> Model Prediction: D
7. Ground Truth: B -> Model Prediction: E
The values within each vertical rectangle are arranged vertically, suggesting a scale or ordering. The numerical values in the "Model predictions" rectangles range from approximately 2 to 5. The alphabetical values are A, B, C, D, and E.
### Key Observations
* The model consistently mispredicts the ground truth values. There are no correct predictions.
* The model appears to consistently overestimate the numerical values (1 and 2 are predicted as 4 and 5 respectively).
* The model's predictions for the alphabetical values also deviate from the ground truth.
* There is a clear pattern of systematic error in the model's predictions.
### Interpretation
The diagram demonstrates a significant discrepancy between the model's predictions and the actual ground truth values. The model consistently makes incorrect predictions, indicating a potential issue with the model's training, architecture, or the data it was trained on. The systematic nature of the errors suggests that the model may be biased or have a limited understanding of the underlying relationships in the data. The consistent overestimation of numerical values could indicate a scaling issue or a bias towards higher values. Further investigation is needed to identify the root cause of these errors and improve the model's performance. The diagram serves as a clear visual representation of the model's shortcomings and highlights the need for further refinement.