## Bar Chart: Subtractor: Time vs Core count
### Overview
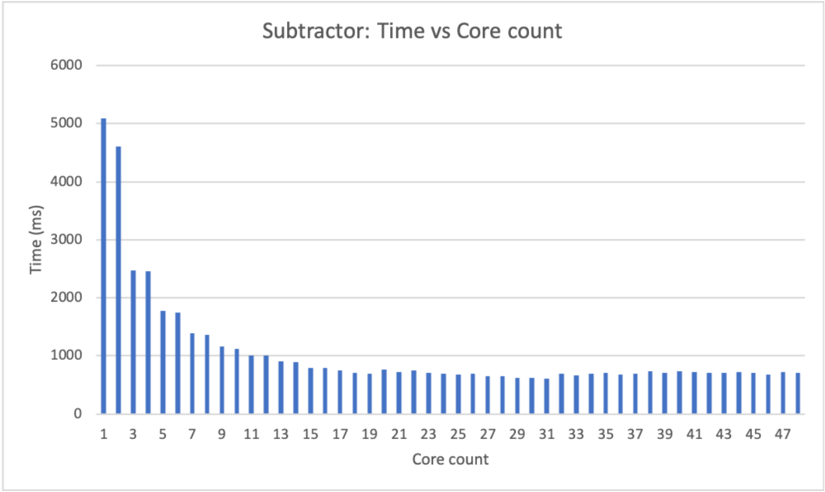
The image is a bar chart that displays the relationship between the time taken (in milliseconds) and the core count for a "Subtractor" operation. The x-axis represents the core count, ranging from 1 to 47. The y-axis represents the time in milliseconds, ranging from 0 to 6000. The chart shows a general trend of decreasing time with an increasing number of cores, with a steep drop initially, followed by a more gradual decrease.
### Components/Axes
* **Title:** Subtractor: Time vs Core count
* **X-axis:**
* Label: Core count
* Scale: 1 to 47, incrementing by 2 (1, 3, 5, 7, ..., 47)
* **Y-axis:**
* Label: Time (ms)
* Scale: 0 to 6000, incrementing by 1000 (0, 1000, 2000, 3000, 4000, 5000, 6000)
* **Data:** Blue bars representing the time taken for each core count.
### Detailed Analysis
Here's a breakdown of the approximate time values for different core counts:
* **1 Core:** Approximately 5050 ms
* **3 Cores:** Approximately 4600 ms
* **5 Cores:** Approximately 2450 ms
* **7 Cores:** Approximately 1750 ms
* **9 Cores:** Approximately 1700 ms
* **11 Cores:** Approximately 1350 ms
* **13 Cores:** Approximately 1000 ms
* **15 Cores:** Approximately 950 ms
* **17 Cores:** Approximately 800 ms
* **19 Cores:** Approximately 750 ms
* **21 Cores:** Approximately 700 ms
* **23 Cores:** Approximately 700 ms
* **25 Cores:** Approximately 650 ms
* **27 Cores:** Approximately 650 ms
* **29 Cores:** Approximately 600 ms
* **31 Cores:** Approximately 600 ms
* **33 Cores:** Approximately 650 ms
* **35 Cores:** Approximately 650 ms
* **37 Cores:** Approximately 650 ms
* **39 Cores:** Approximately 650 ms
* **41 Cores:** Approximately 700 ms
* **43 Cores:** Approximately 700 ms
* **45 Cores:** Approximately 700 ms
* **47 Cores:** Approximately 700 ms
**Trend:** The time decreases rapidly from 1 core to approximately 11 cores. After that, the decrease is much slower, and the time seems to plateau around 700 ms.
### Key Observations
* The most significant reduction in time occurs when increasing the core count from 1 to around 11.
* Beyond 11 cores, the benefit of adding more cores diminishes significantly.
* The time appears to stabilize around 700 ms for core counts greater than 35.
### Interpretation
The data suggests that increasing the number of cores for the "Subtractor" operation initially leads to a substantial reduction in processing time, indicating effective parallelization. However, after a certain point (around 11 cores), the gains from adding more cores become marginal. This could be due to factors such as communication overhead between cores, limitations in the algorithm's parallelizability, or other bottlenecks in the system. The plateauing of time around 700 ms suggests that there might be a fundamental limit to how fast the operation can be performed, regardless of the number of cores used.