## Histograms: Reward Distribution Comparison (RAP-MCTS vs SC-MCTS*)
### Overview
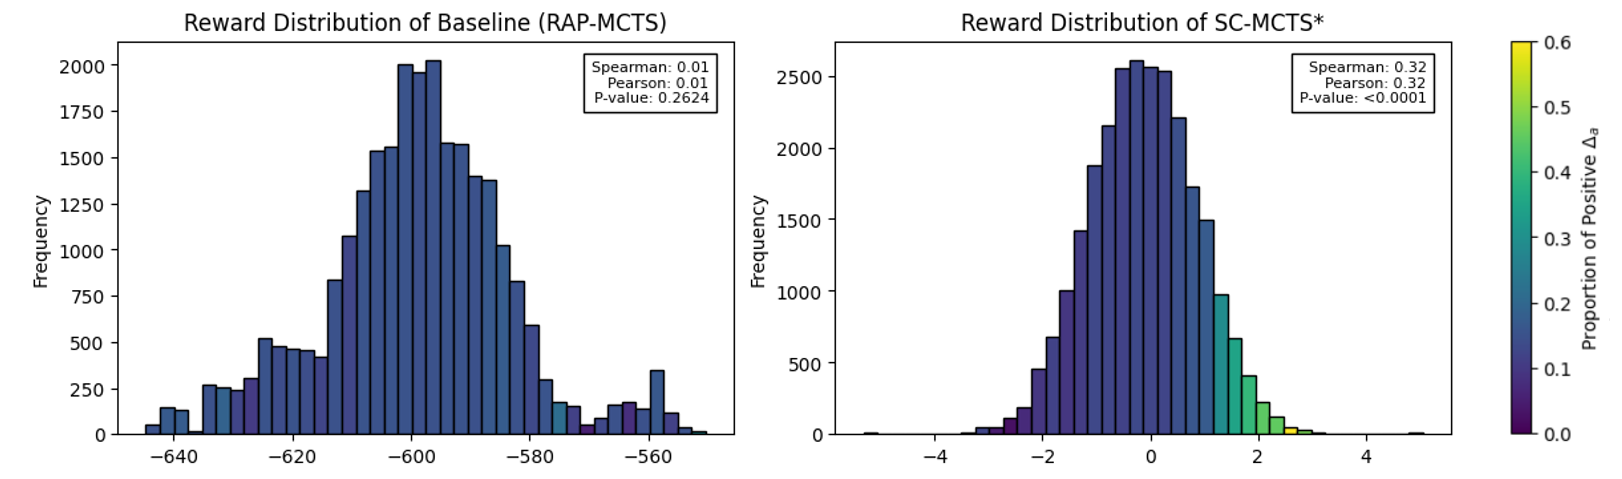
The image contains two side-by-side histograms comparing reward distributions. The left histogram represents the baseline RAP-MCTS system, while the right histogram shows the SC-MCTS* system. Both use frequency counts on the y-axis, with distinct x-axis ranges and color-coded distributions.
### Components/Axes
**Left Histogram (RAP-MCTS):**
- **X-axis**: Reward values ranging from -640 to -560 (intervals of ~20)
- **Y-axis**: Frequency (0 to 2000)
- **Legend**:
- Spearman: 0.01
- Pearson: 0.01
- P-value: 0.2624
- **Color**: Uniform blue bars
**Right Histogram (SC-MCTS*):**
- **X-axis**: Δa values ranging from -4 to 4 (intervals of ~1)
- **Y-axis**: Frequency (0 to 2500)
- **Legend**:
- Spearman: 0.32
- Pearson: 0.32
- P-value: <0.0001
- **Color Gradient**: Purple (0.0) to Yellow (0.6) indicating "Proportion of Positive Δa"
### Detailed Analysis
**Left Histogram (RAP-MCTS):**
- Peak frequency (~2000) occurs at reward value -600
- Distribution spreads symmetrically between -640 and -560
- Frequencies decrease gradually toward the edges
- No visible color variation (uniform blue)
**Right Histogram (SC-MCTS*):**
- Peak frequency (~2500) occurs at Δa = 0
- Distribution narrows significantly compared to RAP-MCTS
- Right tail (positive Δa) shows higher frequency density
- Color gradient transitions from purple (left) to yellow (right), indicating increasing proportion of positive Δa values
### Key Observations
1. **Distribution Shape**:
- RAP-MCTS shows a wider, more uniform distribution
- SC-MCTS* exhibits a sharper peak at 0 with steeper declines on both sides
2. **Statistical Significance**:
- SC-MCTS* has a P-value <0.0001 vs RAP-MCTS' 0.2624, indicating highly significant differences
- Spearman/Pearson correlations (0.32 vs 0.01) suggest stronger linear relationships in SC-MCTS*
3. **Δa Proportions**:
- Right histogram's color gradient shows ~60% of rewards have positive Δa values (yellow region)
### Interpretation
The SC-MCTS* system demonstrates:
- **Improved Performance**: Narrower, more concentrated reward distribution around 0 suggests better target achievement
- **Statistical Robustness**: Lower P-value (<0.0001) confirms significant improvement over baseline
- **Positive Bias**: Color gradient reveals majority of rewards show positive Δa values, indicating systematic improvement
- **Correlation Strength**: Higher Spearman/Pearson values (0.32) suggest more consistent linear relationships in reward outcomes
The baseline RAP-MCTS shows:
- **Wider Variability**: Broader distribution implies less consistent performance
- **Negative Bias**: All rewards cluster in negative territory (-640 to -560)
- **Weaker Correlations**: Near-zero Spearman/Pearson values indicate minimal linear relationships
The color-coded Δa proportions in SC-MCTS* provide granular insight into reward quality distribution, revealing that higher positive deviations are more frequent in the improved system.