## Scatter Plot: Accuracy vs. EOpp
### Overview
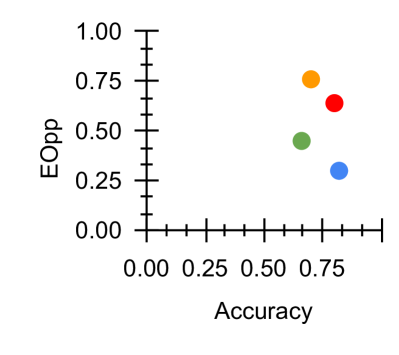
The image is a scatter plot comparing two metrics: "Accuracy" on the horizontal axis and "EOpp" on the vertical axis. Four distinct data points are plotted, each represented by a different colored circle. The plot does not contain a title, a legend, or any explanatory text beyond the axis labels. The data points are clustered in the upper-right quadrant of the chart.
### Components/Axes
* **X-Axis (Horizontal):**
* **Label:** "Accuracy"
* **Scale:** Linear, ranging from 0.00 to approximately 1.00.
* **Major Tick Marks:** 0.00, 0.25, 0.50, 0.75. The axis extends slightly beyond 0.75, suggesting a maximum value of 1.00.
* **Y-Axis (Vertical):**
* **Label:** "EOpp"
* **Scale:** Linear, ranging from 0.00 to 1.00.
* **Major Tick Marks:** 0.00, 0.25, 0.50, 0.75, 1.00.
* **Data Series:** Four individual points, differentiated by color. There is no accompanying legend to define what each color represents.
* **Orange Point**
* **Red Point**
* **Green Point**
* **Blue Point**
### Detailed Analysis
The following table lists the approximate coordinates for each data point, determined by visual inspection of their position relative to the axis tick marks.
| Color | Approximate Accuracy (X) | Approximate EOpp (Y) | Visual Trend Description |
| :--- | :--- | :--- | :--- |
| **Orange** | 0.75 | 0.75 | Positioned at the intersection of the 0.75 grid lines for both axes. |
| **Red** | 0.85 | 0.65 | Located to the right of the orange point (higher accuracy) and slightly below it (lower EOpp). |
| **Green** | 0.65 | 0.45 | Positioned to the left of the orange point (lower accuracy) and significantly below it (lower EOpp). |
| **Blue** | 0.80 | 0.30 | Located to the right of the green point (higher accuracy) and at the lowest EOpp value of the four points. |
**Trend Verification:** There is no single, clear linear trend across all four points. The relationship between Accuracy and EOpp is not monotonic. For instance, moving from the green point to the blue point shows a large increase in Accuracy with a decrease in EOpp. Moving from the blue point to the red point shows a slight increase in both metrics.
### Key Observations
1. **Cluster Location:** All data points are concentrated in the region where Accuracy > 0.50 and EOpp > 0.25.
2. **Highest Values:** The **Orange** point has the highest EOpp (0.75). The **Red** point has the highest Accuracy (~0.85).
3. **Lowest Values:** The **Blue** point has the lowest EOpp (0.30). The **Green** point has the lowest Accuracy (~0.65).
4. **Trade-off Suggestion:** The distribution suggests a potential trade-off or complex relationship between the two metrics. The point with the highest accuracy (Red) does not have the highest EOpp, and the point with the highest EOpp (Orange) does not have the highest accuracy.
### Interpretation
This scatter plot visualizes the performance of four distinct entities (likely machine learning models, algorithms, or experimental conditions) on two key metrics: **Accuracy** and **EOpp**.
* **EOpp** is a common abbreviation for **Equal Opportunity**, a fairness metric in machine learning that measures whether a model's true positive rate is equal across different demographic groups. A higher EOpp value (closer to 1.00) typically indicates a fairer model with respect to this criterion.
* The plot therefore demonstrates the **accuracy-fairness trade-off**. It shows that optimizing for one metric does not guarantee optimization for the other.
* The **Red** model is the most accurate but has a moderate fairness score.
* The **Orange** model achieves the best fairness (EOpp) but at a cost to accuracy compared to the Red model.
* The **Blue** model has high accuracy but the worst fairness score of the group.
* The **Green** model performs poorly on both metrics relative to the others.
The absence of a legend is a critical limitation, as it prevents identification of what each colored point represents (e.g., Model A, Model B, Baseline, etc.). The chart effectively communicates that different configurations lead to different balances between accuracy and fairness, but without labels, the specific conclusions about which entity is which are impossible to draw. The data suggests that achieving both high accuracy and high fairness simultaneously is challenging for the systems being compared.