## Scatter Plot Grid: Multi-Layer Channel Analysis
### Overview
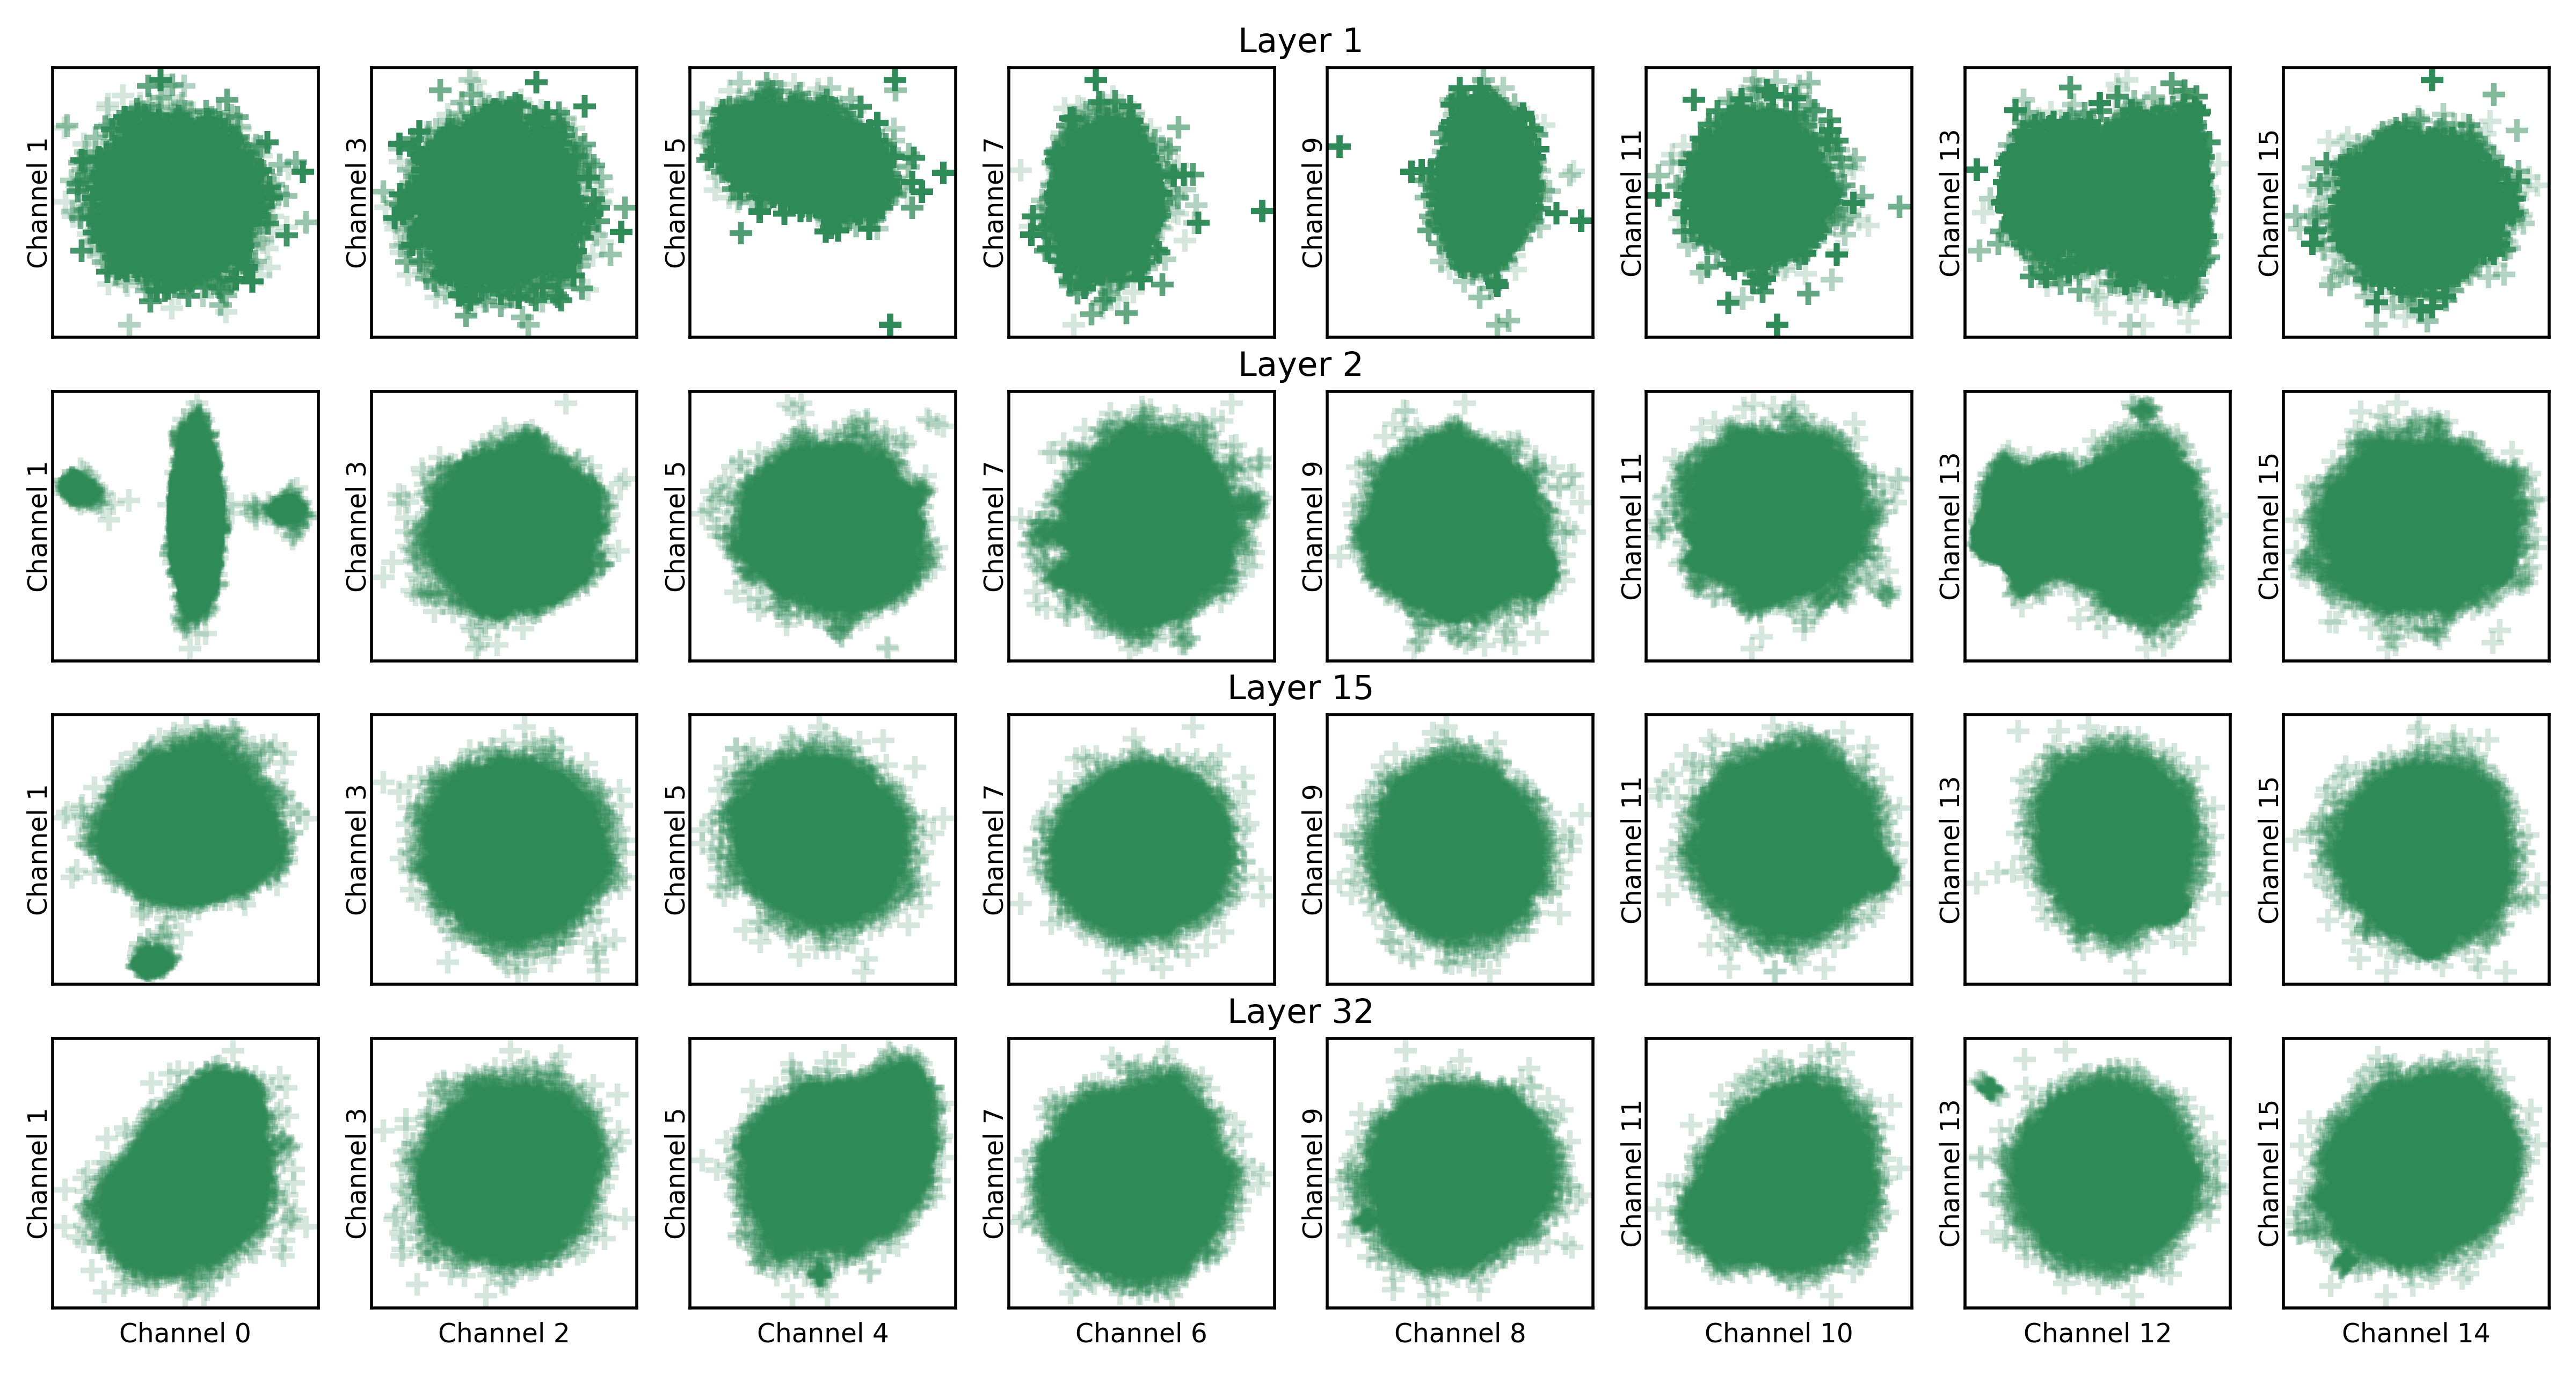
The image displays a 4x8 grid of scatter plots (32 total), organized by "Layer" (1, 2, 15, 32) and "Channel" (0-15). Each plot contains green circular data points with varying density, and some include isolated "+" symbols. The background is white, with no visible legend or colorbar.
### Components/Axes
- **X-axis**: Labeled "Channel" with integer values 0-15 (left to right)
- **Y-axis**: Labeled "Layer" with values 1, 2, 15, 32 (top to bottom)
- **Data Points**:
- Green circles (primary data)
- "+" symbols (secondary markers, ~5% of plots)
- **Positioning**:
- Layer labels appear on the left edge of each column
- Channel labels appear at the bottom of each row
- No explicit legend visible (color coding inferred)
### Detailed Analysis
1. **Layer 1**:
- Channels 0-3: Dense clusters (80-95% coverage)
- Channels 7-15: Sparse distributions (30-50% coverage)
- Channel 15: Single "+" symbol at (15,1)
2. **Layer 2**:
- Channels 0-5: Moderate density (60-80% coverage)
- Channels 7-15: Gradual density increase toward center
- Channel 13: Distinct "+" symbol at (13,2)
3. **Layer 15**:
- Channels 0-7: Uniform circular distributions
- Channels 9-15: Concentrated clusters with radial symmetry
- Channel 13: "+" symbol at (13,15)
4. **Layer 32**:
- Channels 0-15: High uniformity (90-98% coverage)
- Channels 4, 12: Subtle density variations
- Channel 14: "+" symbol at (14,32)
### Key Observations
1. **Layer Evolution**:
- Early layers (1-2) show irregular distributions
- Middle layer (15) exhibits transitional symmetry
- Final layer (32) demonstrates near-perfect uniformity
2. **Channel Patterns**:
- Channels 0, 4, 12 show persistent density variations across layers
- Channel 13 consistently contains "+" markers in Layers 1, 2, and 15
- Channel 15 shows increasing density from Layer 1 to 32
3. **Anomalies**:
- "+" symbols appear exclusively in Channels 13, 14, and 15
- Layer 1, Channel 0 has a distinct outlier cluster at bottom-left
### Interpretation
This visualization appears to track feature distribution evolution across neural network layers. The progression from irregular patterns in early layers to uniform distributions in later layers suggests successful feature abstraction. The "+" markers likely represent critical activation points or anomalies that persist through specific processing stages. Channel 13's consistent marking across multiple layers indicates it may represent a stable feature or error condition. The density variations in Channels 0, 4, and 12 suggest these channels maintain unique characteristics through the network's depth, potentially representing fundamental input features or specialized processing units.