## Bar Charts: Gemma 2 9B Rating Probabilities
### Overview
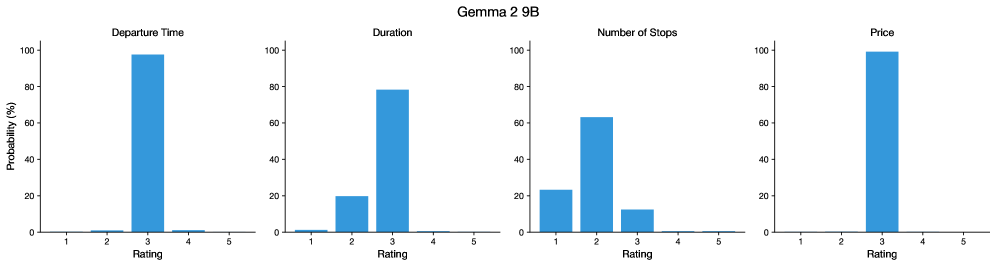
The image displays a series of four vertical bar charts arranged horizontally, collectively titled "Gemma 2 9B". Each chart illustrates the probability distribution (in percentage) of ratings (1 to 5) for a different attribute: Departure Time, Duration, Number of Stops, and Price. The charts suggest an analysis of how a model or system (likely "Gemma 2 9B") rates or is rated on these specific criteria.
### Components/Axes
* **Main Title:** "Gemma 2 9B" (centered at the top).
* **Subplot Titles (from left to right):** "Departure Time", "Duration", "Number of Stops", "Price".
* **Y-Axis (Common to all charts):**
* **Label:** "Probability (%)" (rotated vertically on the far left).
* **Scale:** Linear, from 0 to 100.
* **Markers:** 0, 20, 40, 60, 80, 100.
* **X-Axis (Common to all charts):**
* **Label:** "Rating" (centered below each chart).
* **Scale:** Discrete categories.
* **Markers:** 1, 2, 3, 4, 5.
* **Data Series:** Each chart contains five blue bars, one for each rating category (1-5). The height of each bar represents the probability percentage.
### Detailed Analysis
**1. Departure Time Chart (Leftmost):**
* **Trend:** A single, dominant peak at Rating 3, with negligible probabilities for all other ratings.
* **Data Points (Approximate):**
* Rating 1: ~0%
* Rating 2: ~1%
* Rating 3: ~95%
* Rating 4: ~4%
* Rating 5: ~0%
**2. Duration Chart (Second from left):**
* **Trend:** A strong peak at Rating 3, with a secondary, smaller peak at Rating 2. Ratings 1, 4, and 5 have very low probability.
* **Data Points (Approximate):**
* Rating 1: ~1%
* Rating 2: ~20%
* Rating 3: ~79%
* Rating 4: ~0%
* Rating 5: ~0%
**3. Number of Stops Chart (Third from left):**
* **Trend:** The highest probability is at Rating 2, followed by Rating 1, then Rating 3. Ratings 4 and 5 are near zero.
* **Data Points (Approximate):**
* Rating 1: ~23%
* Rating 2: ~63%
* Rating 3: ~14%
* Rating 4: ~0%
* Rating 5: ~0%
**4. Price Chart (Rightmost):**
* **Trend:** An extreme, near-total concentration of probability at Rating 3. All other ratings have virtually zero probability.
* **Data Points (Approximate):**
* Rating 1: ~0%
* Rating 2: ~0%
* Rating 3: ~100%
* Rating 4: ~0%
* Rating 5: ~0%
### Key Observations
1. **Central Tendency:** For three of the four attributes (Departure Time, Duration, Price), the probability mass is overwhelmingly concentrated on Rating 3.
2. **Attribute-Specific Distribution:** "Number of Stops" is the only attribute with a different modal rating (Rating 2) and a more distributed probability across Ratings 1, 2, and 3.
3. **Low Variance:** The distributions are highly peaked (low variance), indicating strong consensus or model bias toward specific ratings for each attribute.
4. **Absence of Extreme Ratings:** Ratings 4 and 5 have near-zero probability across all attributes. Rating 1 has non-zero probability only for "Number of Stops" and "Duration".
### Interpretation
The data presents a profile of the "Gemma 2 9B" system's rating behavior. The near-exclusive assignment of Rating 3 to **Price** and **Departure Time** suggests these attributes are either considered perfectly average/neutral by the system or that the system has a strong bias to default to the middle rating for these features. The distribution for **Duration** also centers on 3 but shows some tolerance for a lower rating (2). **Number of Stops** is the most differentiated attribute, with the system showing a clear preference for Rating 2, indicating it likely associates a lower number of stops with a better (or worse, depending on the rating scale's direction) experience.
The overall pattern implies the model's ratings are not uniformly distributed but are instead highly deterministic for specific attributes, potentially reflecting training data biases, a simplistic scoring algorithm, or a deliberate design to categorize features into broad buckets (e.g., "average" for most, "slightly below average" for stops). The complete absence of high ratings (4, 5) is notable and could indicate a conservative rating scale, a lack of positive exemplars in the data, or a system calibrated to avoid extreme scores.