# Technical Document Extraction: Varying Sequential/Parallel Performance Analysis
## 1. Document Metadata
* **Title:** Varying Sequential/Parallel
* **Language:** English
* **Image Type:** Multi-series Line Chart with Color Gradient Legend
## 2. Component Isolation
### A. Header
* **Text:** "Varying Sequential/Parallel"
* **Function:** Main title of the visualization.
### B. Main Chart Area (Axes and Data)
* **Y-Axis Label:** MATH Test Accuracy (%)
* **Y-Axis Scale:** Linear, ranging from 20 to 40.
* **Markers:** 20, 22, 25, 28, 30, 32, 35, 38, 40.
* **X-Axis Label:** Sequential/Parallel Ratio
* **X-Axis Scale:** Logarithmic (Base 2).
* **Markers:** $2^{-5}$, $2^{-3}$, $2^{-1}$, $2^{1}$, $2^{3}$, $2^{5}$.
* **Grid:** Light gray horizontal and vertical grid lines corresponding to axis markers.
### C. Legend (Right Side)
* **Spatial Placement:** [x=right, y=center]
* **Label:** Number of Generations
* **Scale:** Logarithmic color bar.
* **Range:** $10^0$ (1) to $10^2$ (100).
* **Color Gradient:** Light orange (low) $\rightarrow$ Coral/Red (medium) $\rightarrow$ Dark Purple (high).
---
## 3. Data Series Analysis and Trend Verification
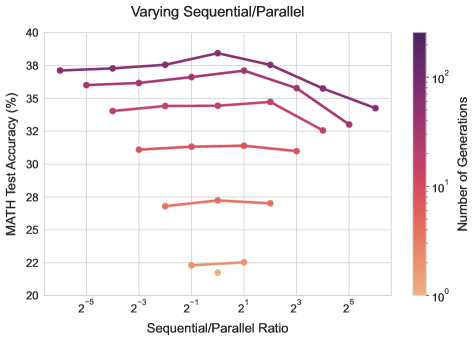
The chart contains 7 distinct data series, categorized by the "Number of Generations" (color).
| Series Color | Approx. Generations | Visual Trend Description | Peak Performance Point (Approx.) |
| :--- | :--- | :--- | :--- |
| **Dark Purple** | ~256 | Slopes upward gradually, peaks at $2^0$, then declines sharply. | ~38.5% at $2^0$ |
| **Deep Plum** | ~128 | Slopes upward, peaks at $2^1$, then declines. | ~37% at $2^1$ |
| **Magenta/Red** | ~64 | Relatively flat with a slight peak at $2^2$, then declines. | ~34.5% at $2^2$ |
| **Coral Red** | ~32 | Very flat trajectory across the center of the x-axis. | ~31.5% at $2^1$ |
| **Orange-Red** | ~16 | Short segment, slight upward slope toward the center. | ~27.5% at $2^0$ |
| **Light Orange** | ~4 | Very short segment, nearly flat. | ~22% at $2^1$ |
| **Pale Orange** | ~1 | Single data point. | ~21.5% at $2^0$ |
---
## 4. Extracted Data Points (Estimated)
Values are extracted by cross-referencing the marker position against the grid lines.
| Sequential/Parallel Ratio ($2^x$) | Dark Purple (~256 Gen) | Deep Plum (~128 Gen) | Magenta (~64 Gen) | Coral (~32 Gen) | Orange (~16 Gen) |
| :--- | :--- | :--- | :--- | :--- | :--- |
| **$2^{-6}$** | 37.2% | - | - | - | - |
| **$2^{-5}$** | 37.3% | 36.0% | - | - | - |
| **$2^{-4}$** | 37.4% | 36.1% | 34.0% | - | - |
| **$2^{-3}$** | 37.5% | 36.2% | 34.3% | 31.2% | - |
| **$2^{-2}$** | 37.6% | 36.5% | 34.4% | 31.3% | 27.0% |
| **$2^{-1}$** | 38.0% | 36.8% | 34.4% | 31.4% | 27.2% |
| **$2^{0}$** | **38.5%** | 37.2% | 34.5% | 31.5% | **27.5%** |
| **$2^{1}$** | 38.0% | **37.5%** | 34.6% | **31.6%** | 27.4% |
| **$2^{2}$** | 37.5% | 36.5% | **34.8%** | 31.4% | - |
| **$2^{3}$** | 36.5% | 35.8% | 33.5% | 31.2% | - |
| **$2^{4}$** | 35.8% | 34.5% | 32.1% | - | - |
| **$2^{5}$** | 35.0% | 32.8% | - | - | - |
| **$2^{6}$** | 34.2% | - | - | - | - |
---
## 5. Key Findings and Insights
1. **Generational Scaling:** There is a direct positive correlation between the "Number of Generations" and "MATH Test Accuracy." The highest accuracy (~38.5%) is achieved at the highest generation count (darkest purple).
2. **Optimal Ratio:** For most generation counts, the optimal "Sequential/Parallel Ratio" falls between $2^0$ (1) and $2^2$ (4).
3. **Performance Degradation:** Accuracy drops significantly when the ratio becomes too high (too sequential) or too low (too parallel), though the drop-off is more pronounced on the sequential side (right side of the graph).
4. **Diminishing Returns:** As the number of generations decreases (moving toward orange), the sensitivity to the Sequential/Parallel ratio appears to decrease, resulting in flatter curves.