\n
## Line Chart: Average Accuracy vs. Training Step
### Overview
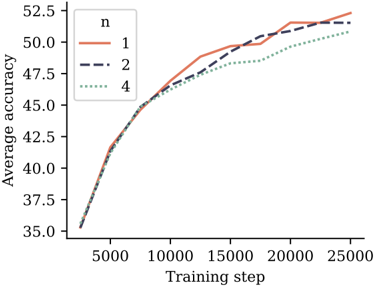
This image presents a line chart illustrating the relationship between average accuracy and training step for different values of 'n'. The chart displays three lines, each representing a different 'n' value, showing how accuracy changes as the training progresses.
### Components/Axes
* **X-axis:** Training step, ranging from approximately 0 to 25000.
* **Y-axis:** Average accuracy, ranging from approximately 35.0 to 52.5.
* **Legend:** Located in the top-left corner, identifies the lines based on the value of 'n':
* n = 1 (Solid brown line)
* n = 2 (Dashed dark blue line)
* n = 4 (Dotted light grey line)
### Detailed Analysis
* **Line n=1 (Solid brown):** This line starts at approximately 36.0 at a training step of 0, increases steadily, and plateaus around 51.0-51.5 after approximately 15000 training steps.
* At 5000 training steps: ~41.0
* At 10000 training steps: ~47.0
* At 15000 training steps: ~49.5
* At 20000 training steps: ~51.0
* At 25000 training steps: ~51.2
* **Line n=2 (Dashed dark blue):** This line also starts at approximately 36.0 at a training step of 0, increases more rapidly than n=1 initially, reaches a peak around 51.5 at approximately 20000 training steps, and then slightly decreases to around 51.0 at 25000 training steps.
* At 5000 training steps: ~42.5
* At 10000 training steps: ~48.5
* At 15000 training steps: ~50.0
* At 20000 training steps: ~51.5
* At 25000 training steps: ~51.0
* **Line n=4 (Dotted light grey):** This line starts at approximately 36.0 at a training step of 0, increases at a slower rate than both n=1 and n=2, and plateaus around 48.5-49.0 after approximately 15000 training steps.
* At 5000 training steps: ~39.5
* At 10000 training steps: ~45.0
* At 15000 training steps: ~47.5
* At 20000 training steps: ~48.5
* At 25000 training steps: ~49.0
### Key Observations
* All three lines show an increasing trend in average accuracy with increasing training steps, indicating that the model learns over time.
* The line for n=2 exhibits the highest accuracy for most of the training process, peaking at approximately 51.5.
* The line for n=4 consistently shows the lowest accuracy among the three values of 'n'.
* The lines converge as the training step increases, suggesting diminishing returns in accuracy improvement beyond a certain point.
### Interpretation
The chart demonstrates the impact of the parameter 'n' on the training process and resulting accuracy. A higher value of 'n' (n=2) appears to lead to faster learning and higher accuracy, at least up to a certain training step. However, the difference in accuracy between n=1 and n=2 is relatively small, and the performance of n=4 is significantly lower. This suggests that 'n' may represent a complexity parameter or a resource allocation factor. The plateauing of all lines indicates that the model is approaching its maximum achievable accuracy with the given training data and configuration. The slight decrease in accuracy for n=2 at the very end of the training process could indicate overfitting, where the model begins to perform worse on unseen data. Further investigation would be needed to determine the optimal value of 'n' and whether additional training or regularization techniques could improve performance.