## Dual-Panel Line Chart: Success Rate vs. Number of Actions (L)
### Overview
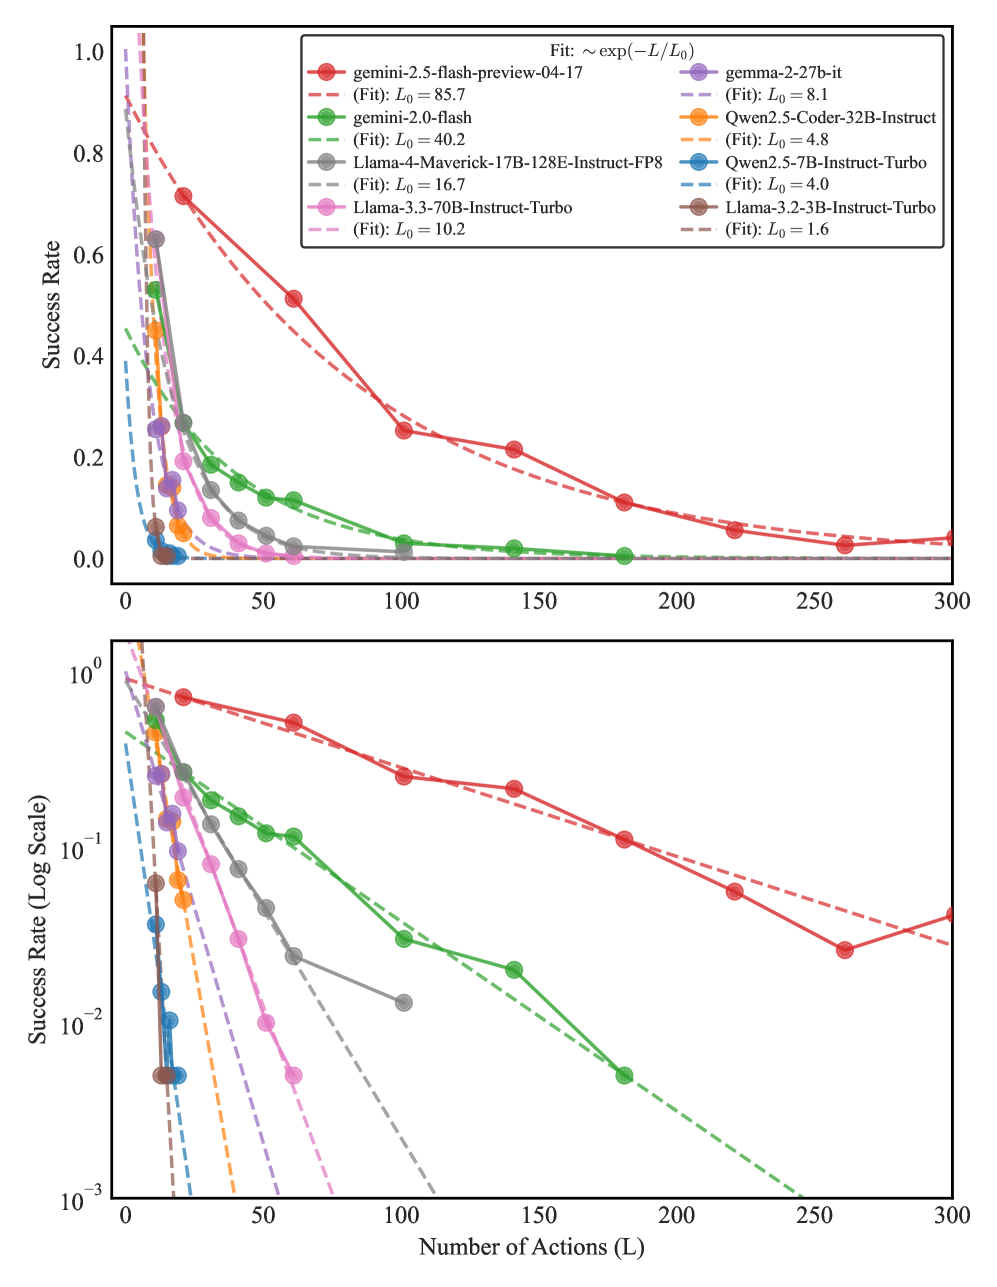
The image displays two line charts comparing the performance of eight different Large Language Models (LLMs) across varying task lengths, defined as "Number of Actions (L)." The top chart uses a linear y-axis, while the bottom chart uses a logarithmic y-axis to better visualize the rapid performance decay of lower-performing models. The data is modeled using an exponential decay function: $\text{Success Rate} \approx \exp(-L/L_0)$, where $L_0$ represents the characteristic length scale of the model's capability.
### Components/Axes
* **Legend (Top Center):** Lists the eight models, their associated line colors, and their fitted $L_0$ values.
* **X-Axis (Shared):** "Number of Actions (L)". Ranges from 0 to 300.
* **Y-Axis (Top Chart):** "Success Rate". Linear scale ranging from 0.0 to 1.0.
* **Y-Axis (Bottom Chart):** "Success Rate (Log Scale)". Logarithmic scale ranging from $10^{-3}$ to $10^0$.
* **Data Series:** Each model is represented by a solid line with circular markers (data points) and a dashed line representing the exponential fit.
### Detailed Analysis
#### Legend and Model Parameters
The models are ordered by their $L_0$ value (characteristic length), which correlates with their ability to maintain success over longer action sequences.
| Model | Color | Fitted $L_0$ |
| :--- | :--- | :--- |
| **gemini-2.5-flash-preview-04-17** | Red | 85.7 |
| **gemini-2.0-flash** | Green | 40.2 |
| **Llama-4-Maverick-17B-128E-Instruct-FP8** | Grey | 16.7 |
| **Llama-3.3-70B-Instruct-Turbo** | Pink | 10.2 |
| **gemma-2-27b-it** | Purple | 8.1 |
| **Qwen2.5-Coder-32B-Instruct** | Orange | 4.8 |
| **Qwen2.5-7B-Instruct-Turbo** | Blue | 4.0 |
| **Llama-3.2-3B-Instruct-Turbo** | Brown | 1.6 |
#### Visual Trends
* **General Trend:** All models exhibit an exponential decay in success rate as the number of actions ($L$) increases.
* **Top-Performing Models (Red/Green):** The `gemini-2.5-flash-preview-04-17` (Red) and `gemini-2.0-flash` (Green) lines show the shallowest slopes. The Red line remains above a 0.05 success rate even at $L=300$.
* **Mid-Tier Models (Grey/Pink/Purple):** These models show a moderate decay. The Grey line (`Llama-4-Maverick`) is the most robust of this group, extending to $L \approx 100$ before dropping near the baseline.
* **Low-Tier Models (Orange/Blue/Brown):** These models exhibit extremely rapid decay. Their success rates collapse toward zero almost immediately (between $L=10$ and $L=25$).
### Key Observations
* **The $L_0$ Metric:** The $L_0$ value acts as a "half-life" equivalent for model performance. A higher $L_0$ indicates a model that is significantly more capable of handling long-horizon tasks.
* **Logarithmic Clarity:** The bottom chart is essential for distinguishing the performance of the lower-tier models. On the linear chart, the Orange, Blue, and Brown lines appear to hit zero almost instantly. On the log chart, we can see they maintain non-zero success rates at very low $L$ values before plummeting.
* **Outlier Performance:** The `gemini-2.5-flash-preview-04-17` (Red) is a significant outlier, with an $L_0$ (85.7) more than double that of the next best model (`gemini-2.0-flash`, 40.2), indicating a substantial leap in long-context reasoning capability.
### Interpretation
This data demonstrates the "contextual endurance" of various LLMs. In the context of agentic workflows or multi-step reasoning, the "Number of Actions" represents the depth of the reasoning chain.
* **Peircean Investigative View:** The $L_0$ value is the *interpretant* of the model's architecture. It serves as a proxy for the model's ability to maintain coherence over time. The exponential decay suggests that these models suffer from a cumulative error rate; each additional action introduces a probability of failure, and the models with lower $L_0$ values accumulate these errors much faster.
* **Practical Implication:** If a task requires a sequence of 50 actions, only the Red, Green, and potentially the Grey models are viable candidates. The other models would likely fail with near-certainty, as their success rates at $L=50$ are negligible on the logarithmic scale. The data suggests that model size (e.g., 70B vs 3B) is not the only factor; architecture and training (as seen by the Gemini models' dominance) are the primary drivers of long-horizon success.