TECHNICAL ASSET FINGERPRINT
edb3fd42fd74f78dcd752f85
Click to view fullscreen
Press ESC or click to close
FOUND IN PAPERS
EXPERT: healer-alpha-free VERSION 1
RUNTIME: free/openrouter/healer-alpha
INTEL_VERIFIED
\n
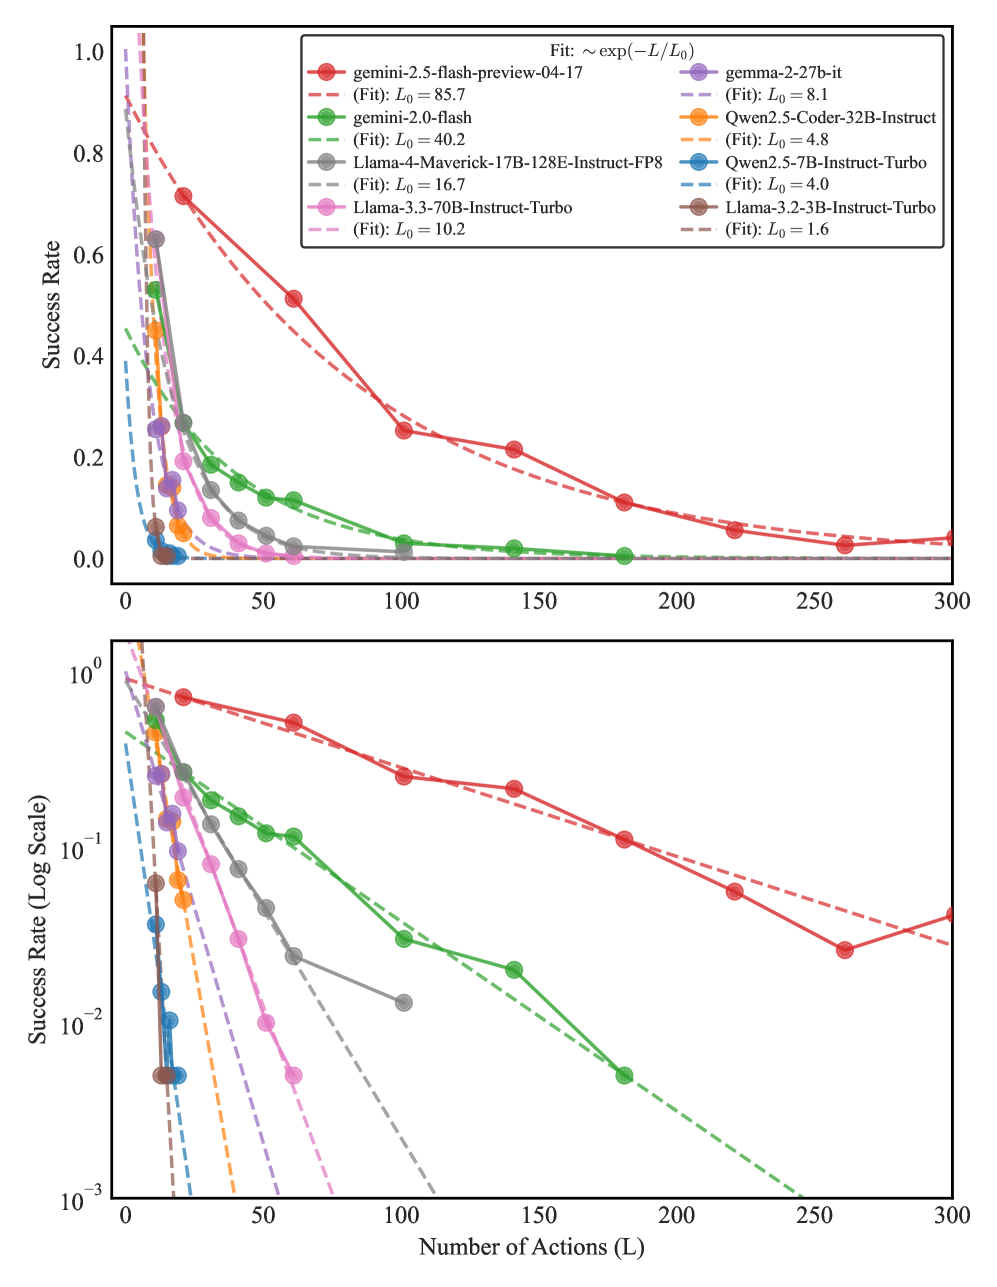
## Performance Comparison Chart: AI Model Success Rate vs. Number of Actions
### Overview
The image contains two line charts comparing the performance of nine different AI models. The charts plot the "Success Rate" of each model against the "Number of Actions (L)" it is required to perform. The top chart uses a linear scale for the y-axis, while the bottom chart uses a logarithmic scale for the y-axis to better visualize performance differences at lower success rates. The data suggests an exponential decay in success rate as the number of actions increases for all models.
### Components/Axes
* **X-Axis (Both Plots):** Labeled "Number of Actions (L)". The scale runs from 0 to 300, with major tick marks at 0, 50, 100, 150, 200, 250, and 300.
* **Y-Axis (Top Plot):** Labeled "Success Rate". The scale is linear, running from 0.0 to 1.0, with major tick marks at 0.0, 0.2, 0.4, 0.6, 0.8, and 1.0.
* **Y-Axis (Bottom Plot):** Labeled "Success Rate (Log Scale)". The scale is logarithmic (base 10), running from 10⁻³ (0.001) to 10⁰ (1.0), with major tick marks at 10⁻³, 10⁻², 10⁻¹, and 10⁰.
* **Legend (Top-Right of Top Plot):** A box containing the model names, their corresponding line colors and markers, and the parameters for their fitted exponential decay curves. The fit formula is given at the top of the legend box as: `Fit: ~ exp(-L / L₀)`.
* **gemini-2.5-flash-preview-04-17:** Red line with circle markers. (Fit: L₀ = 85.7)
* **gemini-2.0-flash:** Green line with circle markers. (Fit: L₀ = 40.2)
* **Llama-4-Maverick-17B-128E-Instruct-FP8:** Gray line with circle markers. (Fit: L₀ = 16.7)
* **Llama-3.3-70B-Instruct-Turbo:** Pink line with circle markers. (Fit: L₀ = 10.2)
* **gemma-2-27b-it:** Purple line with circle markers. (Fit: L₀ = 8.1)
* **Qwen2.5-Coder-32B-Instruct:** Orange line with circle markers. (Fit: L₀ = 4.8)
* **Qwen2.5-7B-Instruct-Turbo:** Blue line with circle markers. (Fit: L₀ = 4.0)
* **Llama-3.2-3B-Instruct-Turbo:** Brown line with circle markers. (Fit: L₀ = 1.6)
### Detailed Analysis
**Trend Verification:** All data series show a downward trend, with success rate decreasing as the number of actions (L) increases. The decay appears exponential, as indicated by the fitted dashed lines.
**Data Points & Model Performance (Approximate values from visual inspection):**
1. **gemini-2.5-flash-preview-04-17 (Red):**
* **Trend:** Slowest decay, highest overall performance.
* **Points (Top Plot):** L=0, Success≈1.0; L=50, Success≈0.5; L=100, Success≈0.25; L=200, Success≈0.1; L=300, Success≈0.05.
* **Points (Bottom Plot):** Confirms the trend, showing a near-linear decline on the log scale.
2. **gemini-2.0-flash (Green):**
* **Trend:** Second-best performance, decay faster than gemini-2.5-flash.
* **Points (Top Plot):** L=0, Success≈0.9; L=50, Success≈0.15; L=100, Success≈0.05; L=200, Success≈0.01.
* **Points (Bottom Plot):** Shows a steeper slope than the red line on the log scale.
3. **Llama-4-Maverick-17B-128E-Instruct-FP8 (Gray):**
* **Trend:** Moderate decay, performance falls between gemini-2.0-flash and Llama-3.3-70B.
* **Points (Top Plot):** L=0, Success≈0.85; L=50, Success≈0.1; L=100, Success≈0.02.
* **Points (Bottom Plot):** Line ends near L=100, Success≈10⁻².
4. **Llama-3.3-70B-Instruct-Turbo (Pink):**
* **Trend:** Faster decay than the gray line.
* **Points (Top Plot):** L=0, Success≈0.8; L=50, Success≈0.05; L=100, Success≈0.01.
* **Points (Bottom Plot):** Line ends near L=75, Success≈10⁻².
5. **gemma-2-27b-it (Purple):**
* **Trend:** Rapid decay.
* **Points (Top Plot):** L=0, Success≈0.7; L=25, Success≈0.1; L=50, Success≈0.02.
* **Points (Bottom Plot):** Line ends near L=50, Success≈10⁻².
6. **Qwen2.5-Coder-32B-Instruct (Orange):**
* **Trend:** Very rapid decay.
* **Points (Top Plot):** L=0, Success≈0.65; L=25, Success≈0.05.
* **Points (Bottom Plot):** Line ends near L=25, Success≈10⁻².
7. **Qwen2.5-7B-Instruct-Turbo (Blue):**
* **Trend:** Extremely rapid decay.
* **Points (Top Plot):** L=0, Success≈0.5; L=10, Success≈0.05.
* **Points (Bottom Plot):** Line ends near L=15, Success≈10⁻².
8. **Llama-3.2-3B-Instruct-Turbo (Brown):**
* **Trend:** Fastest decay, lowest overall performance.
* **Points (Top Plot):** L=0, Success≈0.4; L=10, Success≈0.02.
* **Points (Bottom Plot):** Line ends near L=10, Success≈10⁻².
### Key Observations
1. **Clear Performance Hierarchy:** There is a distinct and consistent ordering of model performance across the entire range of actions. `gemini-2.5-flash-preview-04-17` is the top performer, followed by `gemini-2.0-flash`, then the Llama and other models in descending order.
2. **Exponential Decay Fit:** The dashed lines representing the exponential fit `~ exp(-L / L₀)` align closely with the data points for each model, confirming this as a good model for the performance drop-off. The `L₀` parameter (decay constant) quantifies this: a higher `L₀` indicates slower decay (e.g., 85.7 for the top model vs. 1.6 for the bottom model).
3. **Log Scale Revelation:** The bottom logarithmic plot clearly shows that while all models start at different success rates, their decay *rates* (the slopes of the lines on the log plot) also differ significantly. The top models have shallower slopes.
4. **Performance Convergence at High L:** On the linear plot, all models' success rates converge towards zero as the number of actions approaches 300, though the top model maintains a small but non-zero rate.
### Interpretation
This data demonstrates a strong inverse relationship between task length (number of sequential actions) and the reliability of AI models in completing them successfully. The exponential decay suggests that each additional action introduces a roughly constant probability of failure, compounding over the sequence.
The significant differences in the `L₀` values (ranging from 85.7 to 1.6) highlight vast disparities in model capability for multi-step reasoning or planning. The `gemini-2.5-flash-preview-04-17` model is approximately 50 times more resilient to increasing task length than the `Llama-3.2-3B-Instruct-Turbo` model, as indicated by their `L₀` ratio.
**Practical Implication:** For applications requiring long sequences of actions (e.g., complex problem-solving, multi-turn dialogue, autonomous agent tasks), model selection is critical. Using a model with a low `L₀` value would lead to a very high likelihood of failure for all but the shortest tasks. The chart provides a quantitative basis for choosing a model based on the expected task length and required reliability. The near-perfect fit to an exponential model also allows for predicting success rates for action counts not explicitly tested.
DECODING INTELLIGENCE...