\n
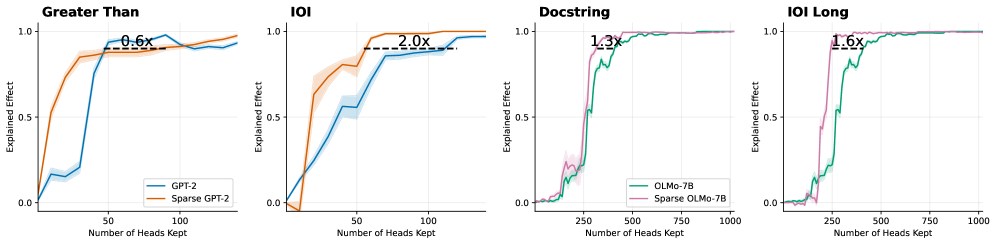
## Charts: Model Performance vs. Number of Heads Kept
### Overview
The image presents four line charts comparing the "Explained Effect" of two model variants (GPT-2 and Sparse GPT-2, or OLMo-7B and Sparse OLMo-7B) as a function of the "Number of Heads Kept". Each chart focuses on a different evaluation metric: "Greater Than", "IOI", "Docstring", and "IOI Long". Each chart also displays a multiplier indicating the relative performance difference between the two model variants.
### Components/Axes
Each chart shares the following components:
* **X-axis:** "Number of Heads Kept" - ranging from 0 to 1000, depending on the chart.
* **Y-axis:** "Explained Effect" - ranging from 0.0 to 1.0.
* **Legend:** Located in the top-left corner of each chart, identifying the two model variants and their corresponding line colors.
* **Title:** Located at the top of each chart, indicating the evaluation metric being used.
* **Multiplier:** A text label indicating the performance ratio between the two models.
The specific labels and ranges are as follows:
* **Chart 1 ("Greater Than"):**
* Models: GPT-2 (blue line), Sparse GPT-2 (orange line)
* Multiplier: 0.6x
* **Chart 2 ("IOI"):**
* Models: GPT-2 (blue line), Sparse GPT-2 (orange line)
* Multiplier: 2.0x
* **Chart 3 ("Docstring"):**
* Models: OLMo-7B (green line), Sparse OLMo-7B (pink line)
* Multiplier: 1.3x
* **Chart 4 ("IOI Long"):**
* Models: OLMo-7B (green line), Sparse OLMo-7B (pink line)
* Multiplier: 1.6x
### Detailed Analysis or Content Details
**Chart 1 ("Greater Than"):**
* The blue line (GPT-2) starts at approximately 0.0 and rapidly increases to around 0.9 by a "Number of Heads Kept" of 75.
* The orange line (Sparse GPT-2) starts at approximately 0.0 and increases more slowly, reaching around 0.75 by a "Number of Heads Kept" of 100.
* The lines converge around a value of 0.9 as the number of heads kept increases.
**Chart 2 ("IOI"):**
* The blue line (GPT-2) rises quickly to approximately 0.85 by a "Number of Heads Kept" of 50.
* The orange line (Sparse GPT-2) rises more gradually, reaching approximately 0.7 by a "Number of Heads Kept" of 50, and then continues to increase, surpassing the blue line at around a "Number of Heads Kept" of 75, reaching approximately 0.95.
**Chart 3 ("Docstring"):**
* The green line (OLMo-7B) starts at approximately 0.0 and rapidly increases to around 0.9 by a "Number of Heads Kept" of 250.
* The pink line (Sparse OLMo-7B) starts at approximately 0.0 and increases more slowly, reaching around 0.6 by a "Number of Heads Kept" of 250, and then continues to increase, approaching the green line but remaining slightly below.
**Chart 4 ("IOI Long"):**
* The green line (OLMo-7B) starts at approximately 0.0 and rapidly increases to around 0.9 by a "Number of Heads Kept" of 250.
* The pink line (Sparse OLMo-7B) starts at approximately 0.0 and increases more slowly, reaching around 0.6 by a "Number of Heads Kept" of 250, and then continues to increase, approaching the green line but remaining slightly below.
### Key Observations
* Sparse models generally perform worse than their non-sparse counterparts, except for the "IOI" metric where Sparse GPT-2 outperforms GPT-2.
* The "IOI" metric shows the most significant performance difference between the models, with Sparse GPT-2 achieving a 2.0x improvement.
* The "Greater Than" metric shows the largest performance gap in favor of the non-sparse model, with Sparse GPT-2 achieving only 0.6x the performance.
* The "Docstring" and "IOI Long" metrics show similar trends, with the sparse models lagging behind but converging with the non-sparse models as the number of heads kept increases.
### Interpretation
These charts demonstrate the trade-offs between model size (number of heads) and performance for different evaluation metrics. The "Explained Effect" likely represents the variance in the target variable explained by the model. The multiplier values quantify the relative performance of the sparse models compared to their dense counterparts.
The fact that Sparse GPT-2 outperforms GPT-2 on the "IOI" metric suggests that sparsity may be particularly beneficial for tasks related to information retrieval or interaction. Conversely, the lower performance on "Greater Than" suggests that sparsity may negatively impact tasks requiring a more comprehensive understanding of relationships.
The convergence of the lines as the number of heads kept increases indicates that the performance gap between sparse and non-sparse models diminishes as more parameters are included. This suggests that sparsity is a useful technique for reducing model size without sacrificing too much performance, especially when computational resources are limited. The choice of which model to use depends on the specific application and the relative importance of performance and efficiency. The "IOI Long" metric appears to behave similarly to the "Docstring" metric, suggesting they are measuring related aspects of model performance.