## Bar Chart: Latency vs. Batch Size for FP16 and w8a8
### Overview
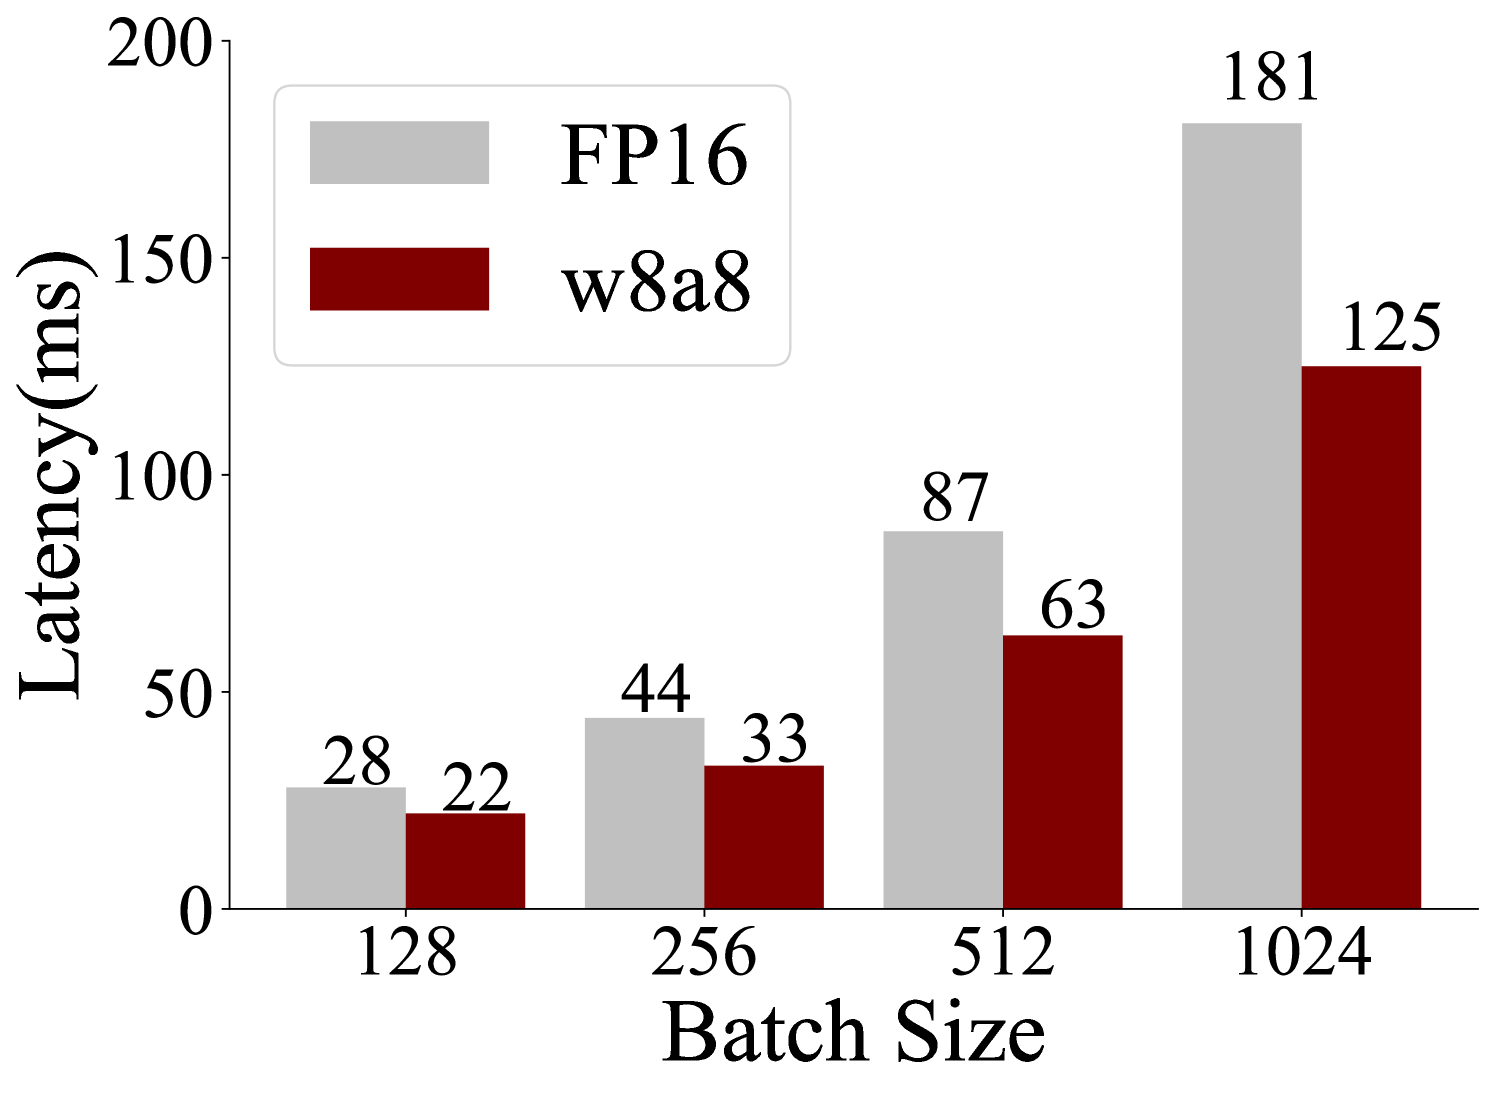
This image is a bar chart that compares the latency (in milliseconds) for two different configurations, FP16 and w8a8, across varying batch sizes. The batch sizes tested are 128, 256, 512, and 1024.
### Components/Axes
* **Y-axis Title**: "Latency(ms)"
* **Scale**: Ranges from 0 to 200, with major tick marks at 0, 50, 100, 150, and 200.
* **X-axis Title**: "Batch Size"
* **Categories**: 128, 256, 512, 1024.
* **Legend**: Located in the top-left quadrant of the chart.
* **FP16**: Represented by a light gray rectangle.
* **w8a8**: Represented by a dark red rectangle.
### Detailed Analysis
The chart displays paired bars for each batch size, with the left bar representing FP16 and the right bar representing w8a8.
* **Batch Size 128**:
* FP16 (light gray bar): 28 ms
* w8a8 (dark red bar): 22 ms
* **Trend**: For this batch size, w8a8 has lower latency than FP16.
* **Batch Size 256**:
* FP16 (light gray bar): 44 ms
* w8a8 (dark red bar): 33 ms
* **Trend**: For this batch size, w8a8 has lower latency than FP16.
* **Batch Size 512**:
* FP16 (light gray bar): 87 ms
* w8a8 (dark red bar): 63 ms
* **Trend**: For this batch size, w8a8 has lower latency than FP16.
* **Batch Size 1024**:
* FP16 (light gray bar): 181 ms
* w8a8 (dark red bar): 125 ms
* **Trend**: For this batch size, w8a8 has lower latency than FP16.
**Overall Trend for both FP16 and w8a8**: As the batch size increases, the latency for both configurations increases significantly. The FP16 configuration consistently shows higher latency than the w8a8 configuration across all tested batch sizes.
### Key Observations
* The latency for both FP16 and w8a8 increases with increasing batch size.
* The w8a8 configuration consistently exhibits lower latency compared to the FP16 configuration for all batch sizes.
* The difference in latency between FP16 and w8a8 appears to widen as the batch size increases.
### Interpretation
This bar chart demonstrates the performance characteristics of two different configurations (FP16 and w8a8) in terms of latency as a function of batch size. The data suggests that the w8a8 configuration is more efficient, offering lower latency across all tested batch sizes. This could be due to optimizations or a more suitable data representation for the underlying hardware or software being used. The increasing latency with larger batch sizes is a common observation in many computational systems, often related to memory constraints, processing overhead, or communication bottlenecks. The widening gap in latency at larger batch sizes might indicate that FP16 scales less favorably than w8a8 under higher load. This information is crucial for system designers and engineers when choosing configurations for optimal performance, especially in scenarios where low latency is a critical requirement.