## Line Chart: Cost per Sequence vs. Sequence Number
### Overview
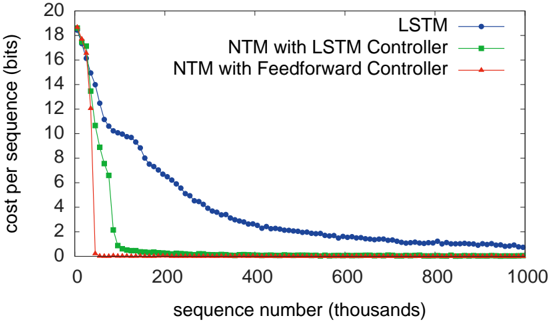
The image is a line chart comparing the cost per sequence (in bits) for three different models: LSTM, NTM with LSTM Controller, and NTM with Feedforward Controller, across a sequence number ranging from 0 to 1000 (thousands). The chart illustrates how the cost decreases as the sequence number increases, indicating learning or optimization over time.
### Components/Axes
* **X-axis:** Sequence number (thousands). Scale ranges from 0 to 1000, with tick marks at 0, 200, 400, 600, 800, and 1000.
* **Y-axis:** Cost per sequence (bits). Scale ranges from 0 to 20, with tick marks at 0, 2, 4, 6, 8, 10, 12, 14, 16, 18, and 20.
* **Legend (Top-Right):**
* Blue line with circle markers: LSTM
* Green line with square markers: NTM with LSTM Controller
* Red line with triangle markers: NTM with Feedforward Controller
### Detailed Analysis
* **LSTM (Blue):** The cost starts at approximately 18 bits and decreases rapidly until around sequence number 200 (thousands), where it begins to level off. By sequence number 1000 (thousands), the cost is approximately 1 bit.
* At sequence number 0: ~18 bits
* At sequence number 100: ~10 bits
* At sequence number 200: ~4 bits
* At sequence number 500: ~1.5 bits
* At sequence number 1000: ~1 bit
* **NTM with LSTM Controller (Green):** The cost starts at approximately 17 bits and decreases very rapidly, reaching a cost of approximately 0 bits by sequence number 150 (thousands).
* At sequence number 0: ~17 bits
* At sequence number 50: ~7 bits
* At sequence number 100: ~1 bits
* At sequence number 150: ~0 bits
* At sequence number 1000: ~0 bits
* **NTM with Feedforward Controller (Red):** The cost starts at approximately 12 bits and decreases very rapidly, reaching a cost of approximately 0 bits by sequence number 50 (thousands).
* At sequence number 0: ~18 bits
* At sequence number 50: ~0 bits
* At sequence number 1000: ~0 bits
### Key Observations
* The NTM with Feedforward Controller converges to a low cost much faster than the other two models.
* The NTM with LSTM Controller also converges quickly, but not as fast as the Feedforward Controller.
* The LSTM model has the slowest convergence rate.
### Interpretation
The chart demonstrates the learning curves of three different neural network models. The NTM with Feedforward Controller appears to be the most efficient in terms of reducing the cost per sequence, followed by the NTM with LSTM Controller. The LSTM model, while still effective, requires a significantly larger number of sequences to achieve a comparable cost reduction. This suggests that the architecture of the NTM models, particularly when paired with a Feedforward Controller, is better suited for this specific task, leading to faster learning and optimization. The rapid initial decrease in cost for all models indicates a quick initial learning phase, followed by a slower refinement as the models approach their optimal performance.