## Line Graph: Cost per Sequence vs. Sequence Number for Different Controllers
### Overview
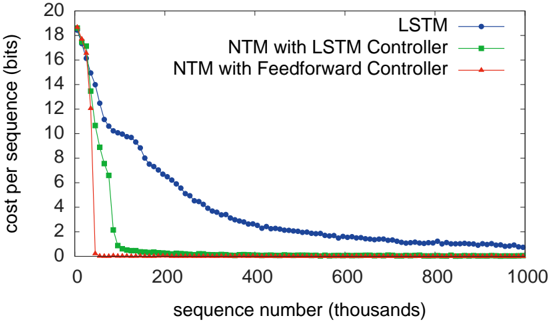
The graph compares the cost per sequence (in bits) across three different controllers (LSTM, NTM with LSTM Controller, and NTM with Feedforward Controller) as a function of sequence number (in thousands). The y-axis represents cost per sequence, while the x-axis represents sequence number. The data shows how the cost evolves over time for each controller.
### Components/Axes
- **X-axis**: "sequence number (thousands)" ranging from 0 to 1000 (in increments of 200).
- **Y-axis**: "cost per sequence (bits)" ranging from 0 to 20 (in increments of 2).
- **Legend**: Located on the right side of the graph.
- **Blue line with circles**: LSTM
- **Green line with squares**: NTM with LSTM Controller
- **Red line with triangles**: NTM with Feedforward Controller
### Detailed Analysis
1. **LSTM (Blue Line)**:
- Starts at approximately **18 bits** at sequence number 0.
- Declines sharply to ~10 bits by 200k sequences.
- Continues a gradual decline, reaching ~2 bits by 1000k sequences.
- Final value: ~1.2 bits at 1000k sequences.
2. **NTM with LSTM Controller (Green Line)**:
- Begins at ~16 bits at sequence number 0.
- Drops rapidly to ~2 bits by 200k sequences.
- Remains near 0.5–1 bit for the remainder of the sequence.
- Final value: ~0.8 bits at 1000k sequences.
3. **NTM with Feedforward Controller (Red Line)**:
- Starts at **0 bits** and remains flat throughout.
- No visible deviation from 0 across all sequence numbers.
### Key Observations
- The **NTM with Feedforward Controller** (red line) maintains a cost of **0 bits** across all sequence numbers, indicating perfect efficiency or a theoretical baseline.
- The **LSTM** (blue line) shows the highest initial cost but improves significantly over time, though it remains higher than the NTM with LSTM Controller.
- The **NTM with LSTM Controller** (green line) achieves the lowest practical cost (~0.8 bits) by 1000k sequences, outperforming LSTM.
- All lines exhibit a **monotonic decline** in cost, with no upward trends or anomalies.
### Interpretation
The data suggests that the **NTM with Feedforward Controller** is the most cost-effective design, as it achieves zero cost per sequence. This could imply an idealized or optimized architecture. The **NTM with LSTM Controller** balances performance and efficiency, outperforming the standalone LSTM, which has higher computational overhead. The sharp decline in LSTM's cost indicates potential for improvement with increased sequence numbers, but it remains less efficient than the NTM-based controllers. The red line's flat zero cost may represent a theoretical limit or a simplified model, highlighting the trade-offs between complexity and efficiency in controller design.